In the days following Wednesday 6 July 2011, stormy westerly conditions affected New Zealand. In this blog, we'll look at why.
The "Long Waves"
Below is the mean sea level analysis - the weather map - for 6am Sunday 10 July. In between big highs over the mid South Pacific and south of western Australia is a really large trough; it's the area shaded light blue. The weather map looked like this, more or less, since Wednesday 6 July: that is, the big features on it aren't moving much.
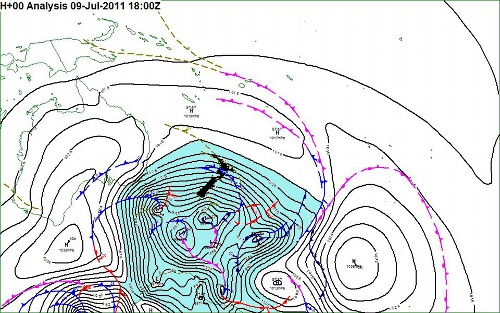 MetService mean sea level analysis for 6am Sunday 10 July 2011.
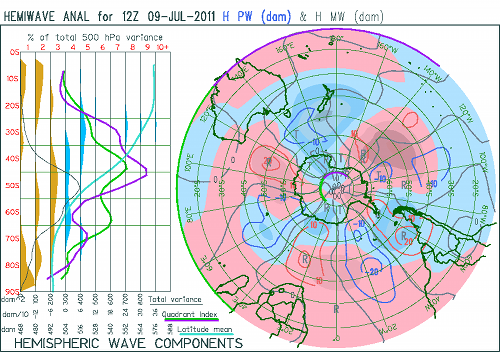
There's good reasons why these big features aren't moving much. They reflect the so-called "long waves" in the troposphere (the troposphere is that part of the Earth's atmosphere in which the weather occurs), which are stationary at the moment. Below is an image made from a Fourier analysis of the wave pattern in the Southern Hemisphere at midnight Saturday 09 July. There's a trough (blue) in this wave pattern more or less in the same place as the one shaded light blue on the weather map above. And either side of this trough, there are ridges (pink) in about the same place as the big highs on the weather map above. For more about this, see my blog post on Wave Three.
Polar Air
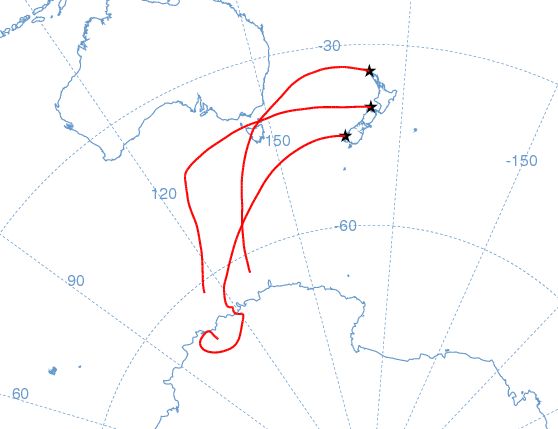
Below is a plot of where the air arriving on New Zealand's west coast at midnight Saturday 09 July came from. The air is from the Antarctic.
"Backward trajectories" of the air at mean sea level arriving at Cape Reinga, Farewell Spit and Secretary Island at midnight Saturday 09 July 2011. Each red line traces the path of the air over the period of a week. That is, the air arriving on New Zealand's west coast at midnight Saturday 09 July left the Antarctic about a week previously. Data courtesy NOAA Air Resources Laboratory.
On its way to New Zealand, this air travelled over a long stretch of ocean. It will have been colder than the surface of the sea it passed over, and will therefore have taken up heat from the sea surface. As heat transfers from the sea surface to the air immediately above it, "blobs" of air become warmer than their surroundings and rise upwards. This process is known as convection (see Chris Webster's blog post about predictability and popcorn). If convection continues for long enough, showers and/or thunderstorms are the result. In the satellite picture below, more or less all of the clouds over the Tasman Sea, New Zealand and the seas to the south of the country are "blobs" of air which is rising (or has recently risen) convectively.
 MTSAT-1R infra-red satellite image for midnight Saturday 09 July 2011. Image courtesy Japan Meteorological Agency.
The Jet
A major flood of air out of the Antarctic region, like this, has other consequences. The northern boundary of the cold air pushes against the warmer air further north. Thus, the north-south temperature contrast increases and simultaneously the strength of the westerly winds increases - not just at the Earth's surface, but throughout the depth of the troposphere. (How this works might be the subject of a future blog post). This is at the heart of why many places were so windy during pervious days. The axis of the strongest winds, in the mid- to upper troposphere, is known as the jet stream. In the plot below (for midnight Saturday 09 July), the polar jet has two branches (arrows in black): one curving across the south Tasman Sea and over the South Island, and the other crossing the south of the North Island. Over central New Zealand, wind speeds above 10,000ft were generally 80 kt (150 km/hr) or more.
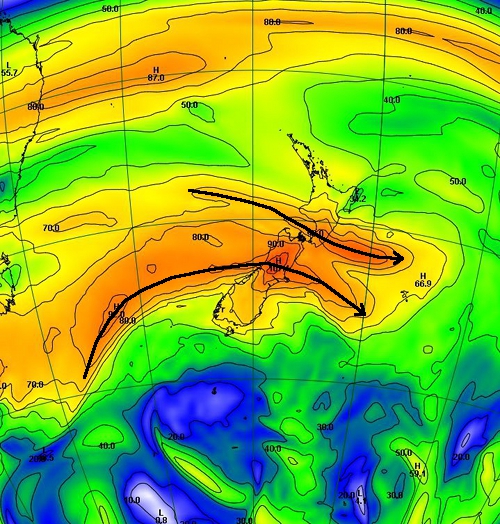 Wind speed at 500 hPa (approximately 18,000 ft) in the New Zealand region at midnight Saturday 09 July 2011. Warmer colours are stronger winds. Data courtesy European Centre for Medium-range Weather Forecasting.
Thunderstorms and Tornadoes
Air ascending into convective clouds (showers and thunderstorms) comes down again. When a convective cloud collapses, the resulting downdraft hits the Earth's surface and spreads out, much like water does when tipped from a bucket onto the ground. When the showers and thunderstorms are themselves fast-moving (on the afternoon of Saturday 09 July, storm motions on the Kapiti Coast were 70 to 90 km/hr), the winds near the Earth's surface can become very strong when downdrafts occur: this is very likely to be the cause of some of the wind damage on the Kapiti Coast on the afternoon of Saturday 09 July. This is one of the reasons why the various Severe Thunderstorm Outlooks, Watches and Warnings issued include the mention of damaging wind gusts.
Imagery (see below) from the Wellington radar for 4:00pm Saturday 09 July shows a line of thunderstorms extending across Cook Strait onto the Kapiti Coast. The tornado is very likely to have been associated with the strong thunderstorm shown just east of Waikanae at 4:00pm; eye witness reports suggest that the tornado crossed State Highway 1 around 3:55pm. The tornado's genesis remains unclear: it may be that a low-level vortex was "spun off" the northern end of Kapiti Island just at the time that this thunderstorm passed by, and the strong ascending motion in the thunderstorm developed it into a tornado between there and landfall on the Kapiti Coast. Once again, it is remarkable that there was no loss of life.
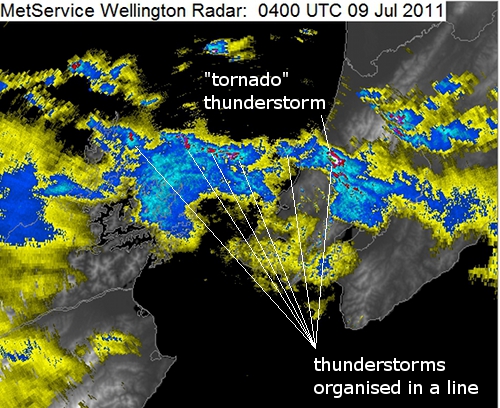 Reflectivity image from the Wellington radar, 4pm Saturday 09 July 2011. Colours represent how strongly precipitation bounces the radar signal back to the radar.
Snow
The Southern Alps are a significant barrier: in westerly airstreams, generally only a moderate amount of precipitation falls any distance east of the Divide. How much precipitation falls east of the Divide, and how far east of the Divide it reaches, depends on a number of factors. Not the least of these is the Foehn Effect. Overnight Saturday 09 July and on the morning of Sunday 10 July, a reasonable amount of snow fell east of the Divide, in parts of Otago, to below 500 metres, in a northwesterly airstream. This is an uncommon occurrence, and reflects how deeply cold and showery the air passing across Otago was at the time.
Large Sea Waves
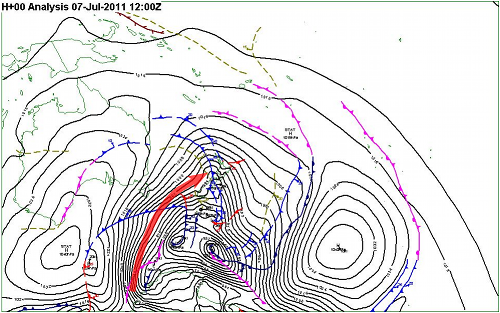
Since about the middle of the first week of July, sea waves arriving on New Zealand's western coasts have been notably large. In some places, they have probably attained heights observed only once every year or two - and will remain high until late in the week ending Fri-15-Jul. The weather map below, from about the time large waves began arriving, shows why:
-
The fetch - that is, the expanse of ocean over which waves arriving on New Zealand's western coasts have been generated (pink arrow) - is very long
-
The waves are still growing as they reach New Zealand's western coasts, because the winds across New Zealand are themselves strong.
