Written in September 2010
New Zealand has been in a strong west to southwest flow for a few days now. This weather regime looks as though it will continue for the next few days. There are reasons why the weather gets into regimes like this. It has to do with what meteorologists call the "long waves". The map below is one way of depicting what the weather pattern about half-way up the troposphere (the troposphere is that part of the atmosphere in which the weather occurs) looked like at midday Thursday 16 September 2010 New Zealand Standard Time, just before the westerlies broke out across the country. In this pattern, there's nothing that looks like a high, or low, or front. But there is a bunch of wavy lines ... which look kind of regular, but not quite.

Image provided by Physical Sciences Division, Earth System Research Laboratory, NOAA, Boulder, Colorado, from their Web site at http://www.esrl.noaa.gov/psd/
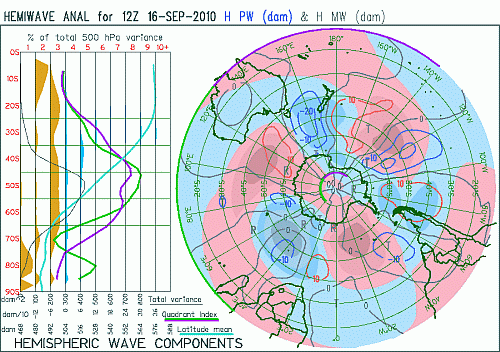
Now what if those waves could be separated out into longer ones and shorter ones, so we could see what was going on "under the bonnet"? There happens to be a way of doing exactly this; it's called Fourier analysis. (Here we stand on the brink of numerical weather prediction, but we'll go there some other time). The picture below is made from a Fourier analysis of the pattern 12 hours further on from the one shown above. It reveals that, in New Zealand's latitudes, it's dominated by a wave which has three troughs (blue) and three ridges (pink) wrapped around the hemisphere. Most important to us is the big area of blue shading - a trough - near New Zealand.

The "long" and "medium" waves about half-way up the troposphere at midnight Thursday 16 September 2010
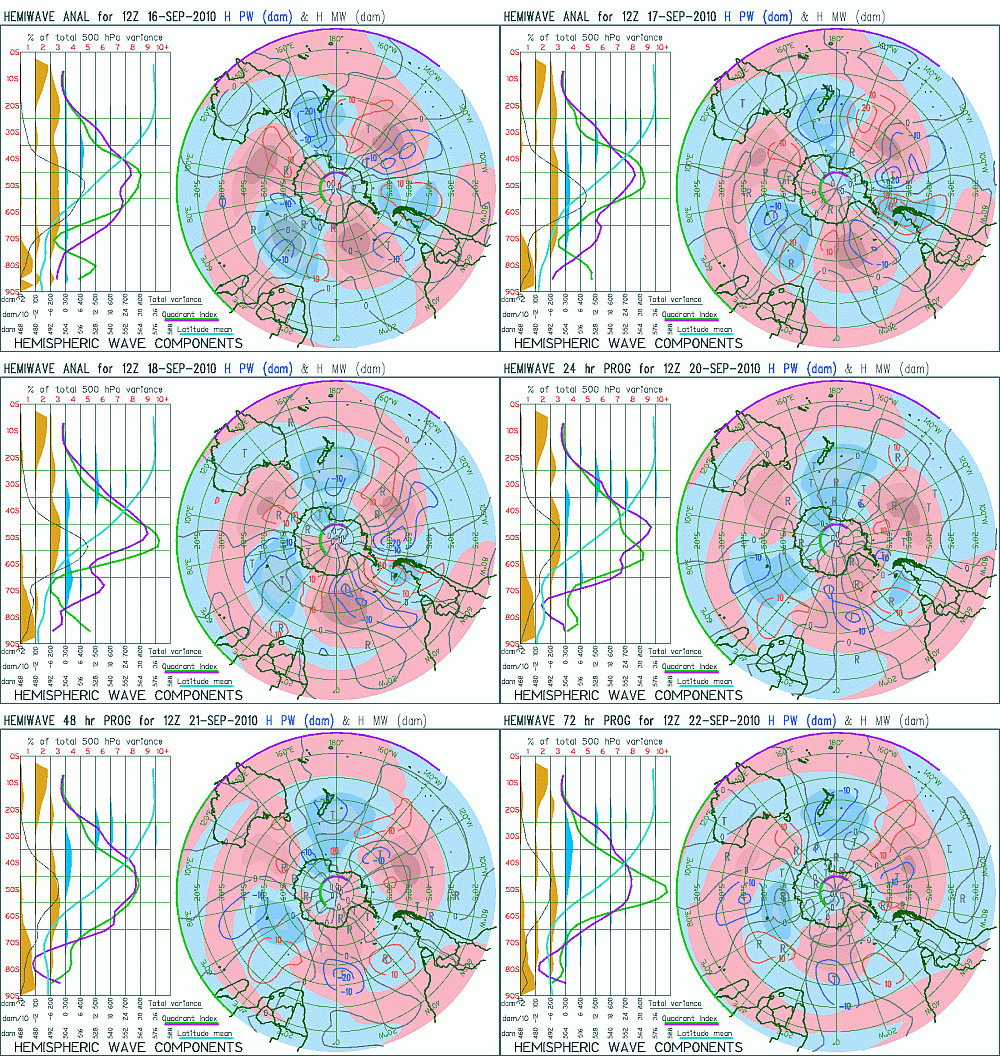
The animation below shows how this trough in the three-wave pattern edges only slowly onto New Zealand during the few days following Thursday 16 September 2010. "Wave three", as it's often called by meteorologists, is one of the long waves. It tends to move only slowly - which is why, once it's gathered a bit of energy, it can influence the weather over a period of days.

What the "long" and "medium" waves did (and are forecast to do) for the few days following Thursday 16 September 2010
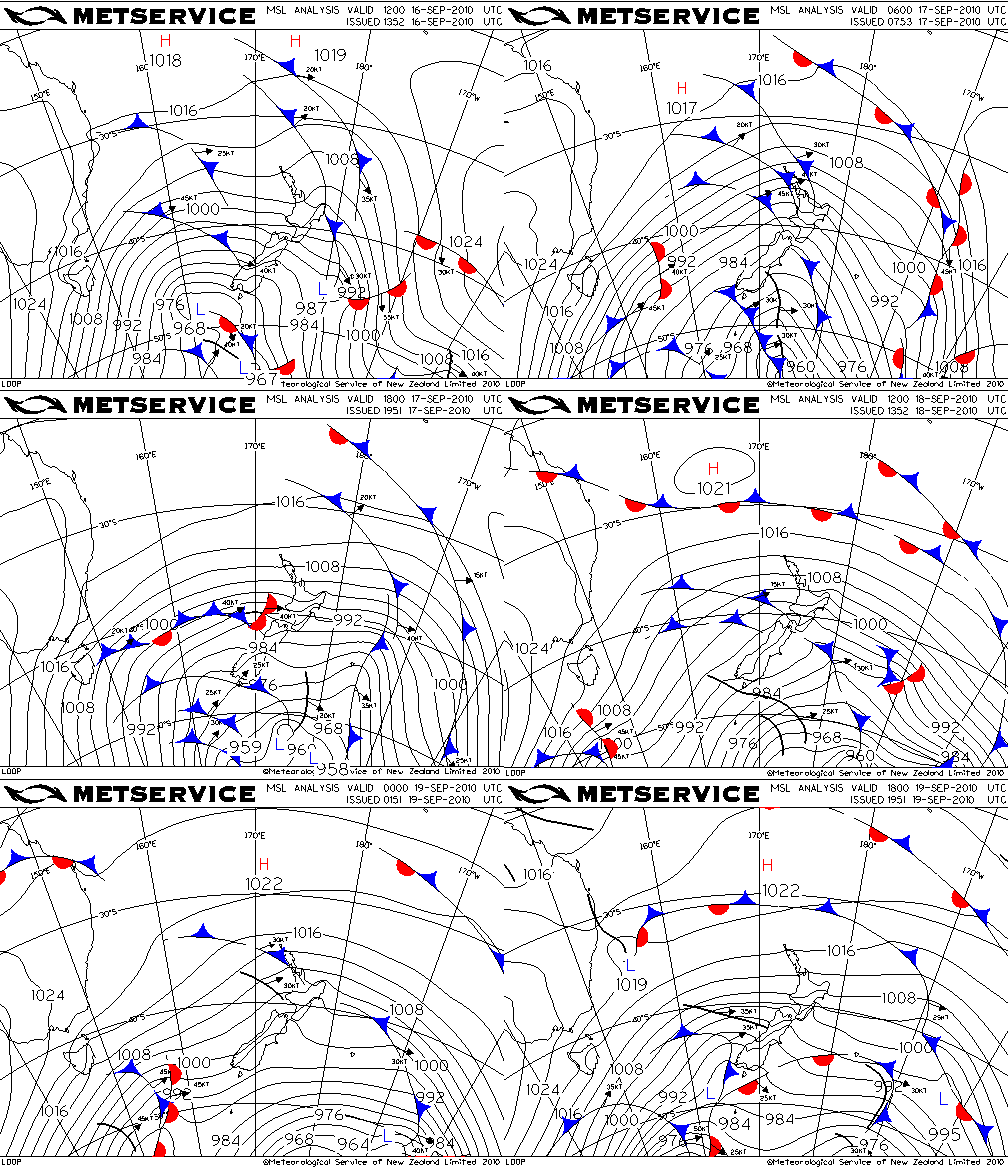
We live on the Earth's surface, at or near the bottom of the troposphere. Down on the Earth's surface, the isobar maps of the last few days (see animation below) have a certain sameness - they all show
-
Tightly packed west to southwest isobars over New Zealand, which is why the wind has been more or less from the same direction
-
Fronts whizzing across the country, which is one of the reasons why showers have come and gone, and the wind shifted around a bit in direction, and gone up and down a bit in strength.
