Understanding Tropical Cyclone/Cyclone Track Maps
Tropical Cyclone (TC) season runs between November 1st to April 30th for New Zealand, and Cyclone Hale is the first ex-TC to affect us this season. MetService’s duties during TC season include publishing track maps, which detail where a Tropical Cyclone has been in the past, and where we expect it to be in the future.
Here’s an example of a track map for Cyclone Hale, issued at 8:36am Jan 10th 2023.
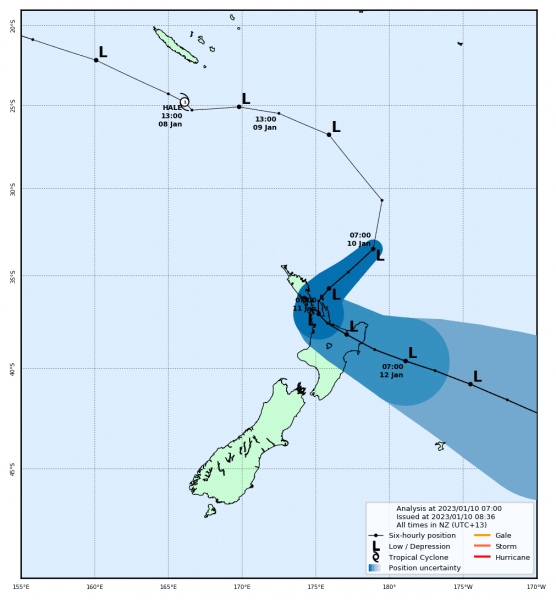
There’s a lot of information packed into this one image. Here’s how to understand what’s going on.
Part One: The Past
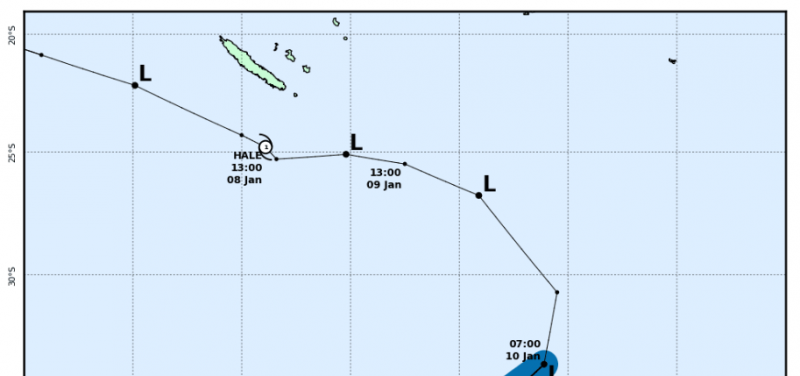
This section of the track map shows the past. The black line on the map shows the path that the centre of the tropical system has taken, with the points on the line showing the position of the centre every six hours. Times are marked in local New Zealand time, which is the (UTC+13) timezone, and are given as twenty four hour times.
Points labelled with a number indicate the category of the system at that point. Find out more about TC categories here. Points labelled with an L indicate the system was not a TC at that point, but still a significant tropical low.
Part Two: The Future
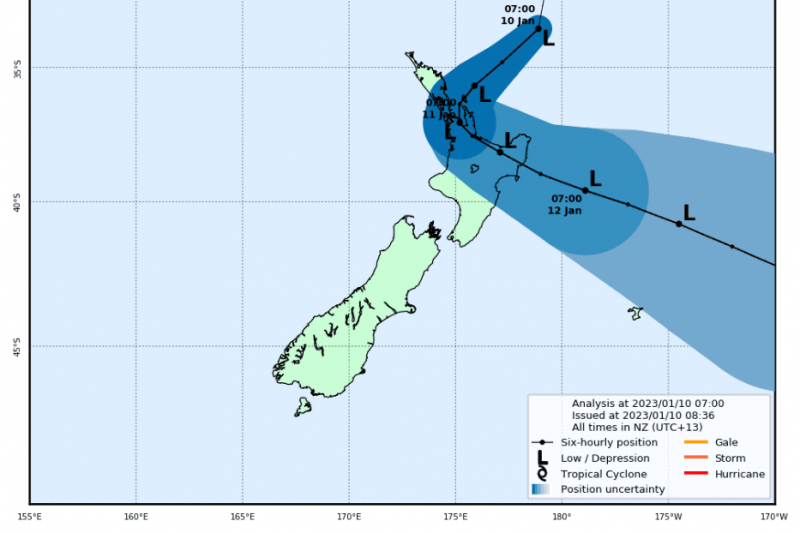
This section of the track map shows the future. We now have a ‘cone’ of dark blue shading through to light blue. This cone indicates the uncertainty in our forecast; forecasting the exact position of the centre of low pressure becomes harder the further ahead we look. The lighter the blue, the more uncertainty in the position of the low.
The black line in the cone shows the best forecast of where we expect the system to move. The centre of the system is most likely to be on or near this line, but could be anywhere inside the cone of uncertainty.
Points on the line are again six hours apart, and are labelled L or with a number as before. The very first point in the cone is where the centre was when the track map was being drawn up, so is approximately ‘now’.
Part Three: Common Questions
- Does this map show where the severe weather will be?
No. This map only tells part of the story. There can be strong winds, heavy rain, and large swells hundreds of kilometres from the centre of the system. Locations outside of the cone of uncertainty may experience severe weather regardless of the position of the system’s centre.
The best place to find out about Severe Weather is on the MetService Warnings page. Remember to stay up to date with the forecasts; more watches and warnings may be issued as the system moves closer to New Zealand.
- Why don’t you always have a track map when there is a Tropical Cyclone?
The meteorologists at MetService only issue track maps when the system moves into New Zealand's area of responsibility. You can find more information about the other Tropical Cyclone Warning Centres here.
- Is it still a Tropical Cyclone when it isn’t in the tropics?
Tropical Cyclones get their energy from the warm waters of the tropics. As they move southwards over cooler waters they lose this energy. Combined with stronger winds higher in the atmosphere the cyclones undergo extra-tropical transition, losing the characteristics that make them Tropical Cyclones.
However, these systems can continue to be very active subtropical areas of low pressure that can bring plenty of severe weather to New Zealand. Find out more here.
On the track maps you can see that the tropical cyclone symbol is replaced with an L once it has undergone the transition.