Tropical Cyclone Gabrielle
By the numbers.
o Whangārei had the largest 24-hour rainfall recorded for any weather station for this event. 183.8mm was recorded from 9am 12 February – 9am 13 February. However, power and communications outages affecting some of our weather stations mean that some places may have seen much more than this.
o Over 200 mm of rain was recorded around the Auckland region with Waitakere recording the most at 248mm.
o Gisborne Airport recorded 185.3mm until power and communications ceased at 2am Tuesday.
o Napier Airport recorded its wettest February day from 9am 13 February – 9am 14 February recording 175.8mm which was also its second wettest day of all time (since records began in 1950).
o Gabrielle has contributed to the wettest start to the year since records began for Whangārei, Auckland, Whitianga, Tauranga, Gisborne, and Napier airports.
o Whangārei, Auckland and Napier have had over five times more rain than their average for the first 46 days of the year. Gisborne has had four times more rain than their average.
o As Cyclone Gabrielle started impacting the North Island on 12 February, Cape Reinga weather station recorded a gust of 141km/h. This was an indication of things to come.
o As the system moved south and east, many areas were impacted by gale force constant wind as well as extreme gusts.
o Whangaparāoa recorded a gust of 132km/h on 13 February.
o Auckland Harbour Bridge recorded a gust of 115 km/h.
o New Plymouth Airport had a gust of 128km/h on 14 February, which was the fourth strongest gust in fifty years of records at that station.
o The biggest wave recorded during the event was 10.9m in the Bay of Islands.
o Storm surge is the abnormal rise of water generated by a storm, over and above the predicted tides. Storm surge of over 0.5 metres was experienced in places along the northern and eastern coasts of the North Island as well as parts of the South Island as the system moved away to the east.
o Coastal inundation and flooding were amplified due to storm surge associated with the cyclone – either by directly inundating the coastal area or by reducing the efficiency of the rivers draining into the sea.
Why was Tropical Cyclone Gabrielle so impactful?
Well before this event, when meteorologists at MetService were asked “What would be the worst weather scenario to impact Aotearoa New Zealand?” A tropical cyclone on the track that Gabrielle took was what was described! One that hit a large number of regions including Auckland. The sheer number of people and urbanization exacerbate any extensive weather event.
The difference between this cyclone and others is the track Gabrielle took, along with warmer sea surface temperatures and an atmospheric environment that encouraged tropical cyclone growth.
Tropical cyclones only form over sea surface temperatures of greater than 26°C. Tropical Cyclone Gabrielle was named by on 8 February 2023 in the Coral Sea and at that time the ocean sea surface temperature was warmer than normal along the corridor from the Coral Sea to Aotearoa New Zealand.
This is likely to have contributed to Gabrielle maintaining its intensity a little longer than normal, and likely contributed to the system holding onto slightly more moisture than normal. Travelling through this warmer environment helps the tropical cyclone gather moisture which fuels more rain.
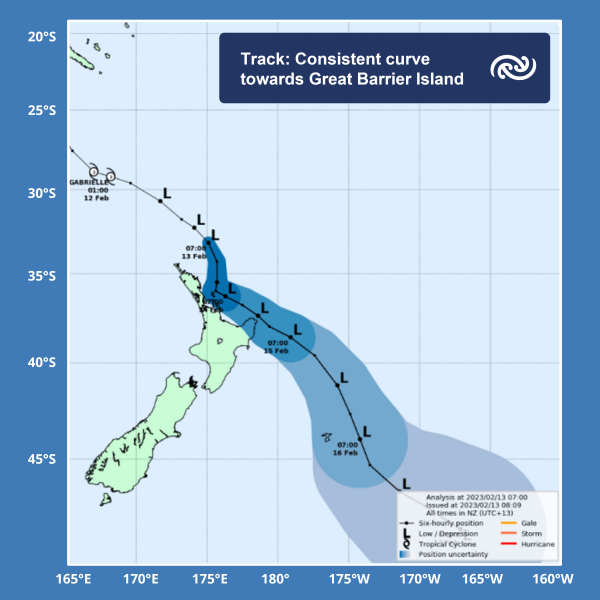
Days ahead of this event the weather models aligned their projections of the forecast track of Gabrielle towards Aotearoa New Zealand. This gave MetService meteorologists confidence that Gabrielle would impact Aotearoa New Zealand.
The key to how impactful Gabrielle was going to be, lay in the curve of the track just north of Aotearoa New Zealand. At this point, higher up in the atmosphere a passing weather feature (trough) lined up to give extra energy to the cyclone and this helped steer it towards the top of the Coromandel Peninsula.
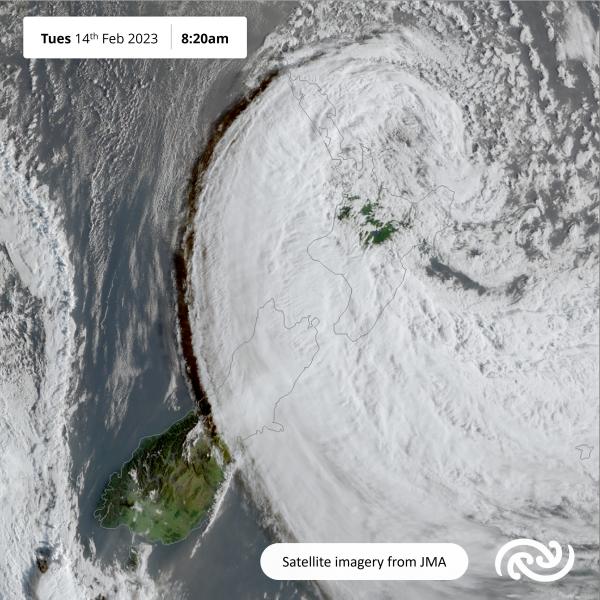
On this more southern direction the center of the cyclone moved closer to Great Barrier Island, where it sat at midnight Monday 13 February, driving wind and rain into Northland, Auckland and the Coromandel Peninsula. After this, the track changed southeasterly and headed towards the East Cape above Gisborne, driving strong winds and torrential rain into the east coast of the North Island, before moving east on a track far north of the Chatham Islands.
The forecast accuracy of Gabrielle’s track was impressive given the difficulty of predicting where tropical cyclones may go. This particular track, combined with how expansive the cyclone was and how deep the central pressure of the cyclone was – is why Gabrielle was so destructive.
As Cyclone Gabrielle passed Aotearoa New Zealand it had an extremely low central pressure of 966.6hPa as recorded at Great Mercury Island. The lower the pressure, the more intense the winds and therefore the greater the impacts of the storm.
The very low pressure of Gabrielle combined with the size/width of the cyclone (covering hundreds of kilometres), spread strong winds across a huge part of the North Island all at once (for example there were gales in Northland and Wellington at the same time).
This extremely low central pressure also influenced the oceans around Aotearoa New Zealand. It raised the level of the ocean at our coast and combined with energetic swell, storm surge, onshore gales and large accumulations of rain literally caused inundation and impeded the rivers outflow to the seas.
The impact of Gabrielle was exacerbated by extensive rainfall on the 27 January hitting the northern areas (in particular Auckland, Northland and Coromandel Peninsula). This left these regions in a vulnerable state so the rainfall and strong winds from Gabrielle had a more extensive impact due to the sodden ground.
When did we first know Gabrielle was threat?
Ten days ahead of its impacts being felt in Aotearoa New Zealand, MetService’s tropical cyclone specialists first raised the potential of a tropical cyclone developing in the Coral Sea. From that point it was monitored more closely to see if it would form. As it developed MetService shared this information with the public and authorities.
The cyclone formed over open waters south of the Solomon Islands and was officially named by Australia’s Bureau of Meteorology (who are the Tropical Cyclone Warning Centre with responsibility for naming cyclones in the Coral Sea) on 8 February. As the system moved closer to Aotearoa New Zealand, and in the early hours of 11 February, the responsibility for forecasting the track of the tropical cyclone was handed to Tropical Cyclone Warning Centre Wellington which is run by MetService.
MetService began issuing Severe Weather Watches for Heavy Rain and Strong Wind from 9 February, followed on the 11 February by a number of the Watch areas being upgraded to Orange Warnings. The first of a swathe of MetService Red Warnings for wind and rain associated with Cyclone Gabrielle were issued that afternoon.
A total of five MetService Red Warnings for Rain (Northland, Auckland, Coromandel, Gisborne, Hawkes Bay) and four MetService Red Warnings for Wind (Northland, Auckland, Coromandel, and Taranaki) were issued over the course of the intensive three-day event.
How it formed.
Cyclone Gabrielle originated as a small low north of Fiji in early February. Although initially weak, it moved slowly westwards into the Coral Sea (south of the Solomon Islands) during Waitangi weekend where conditions were very favourable for the low to intensify into a tropical cyclone.
Three of the key ingredients that helped the tropical cyclone’s formation were:
Can we expect more events like this one?
While climate scientists believe that the number of ex-tropical cyclones affecting Aotearoa New Zealand might remain about the same or perhaps even decline, it is expected they will become more severe as the planet continues to warm. That will mean tropical cyclones will be of a higher category bringing stronger winds, heavier rain, and more problems from wind damage, flooding and storm surge.
The Southern Hemisphere season for tropical cyclones is normally 1 November to 30 April. The South Pacific can expect on average about nine tropical cyclones a year but there are exceptions. Of this nine, on average usually one affects Aotearoa New Zealand. There have been years when we have seen more than that – as has happened in the last two months with Cyclone Hale and now Gabrielle.
We are currently in a La Niña phase, which is conducive to tropical cyclones forming in and around the Coral Sea near Vanuatu and New Caledonia. This is a breeding ground for many of the cyclones that have impacted Aotearoa New Zealand historically.
There is a likely regime change from La Niña to a neutral climate state over the next month. There won’t be a tangible change to our weather maps through the rest of this summer whilst the atmosphere catches up.
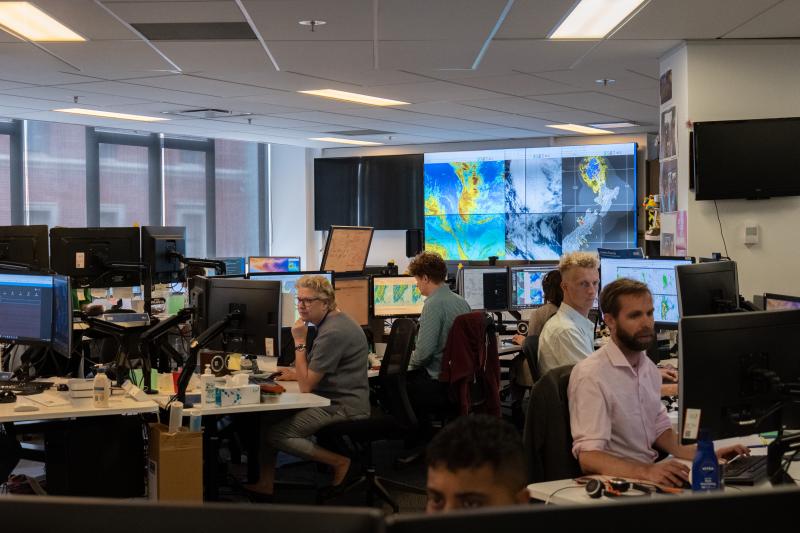
MetService meteorologists are working 24/7, 365 days of the years monitoring the weather around Aotearoa New Zealand and in the Tropics to ensure New Zealanders have timely, useful, and accurate information to best prepare for these impactful events.