Sunny weather dominated the country due to a large anticyclone covering the country and the Tasman Sea during the second week of July 2012.
The chart below shows the position of the centre of the anticyclone at midday Tuesday 10 July 2012. The red arrows show the sense of the broad-scale rotation around the system (anticlockwise in the Southern Hemisphere). It also shows the smaller-scale flow around the top of the South Island, and how this is directed onto Manawatu and Wellington. There are some subtle aspects to this flow that I’d like to investigate in this blog post, using satellite imagery.
 Weather map at midday 10 July 2012.
The term resolution is used to describe the capability to distinguish between objects sitting next to each other. High resolution means that objects that are close together can be separately identified, whereas lower resolution means you can’t tell that there’s more than one object. The term resolution can refer to the number of pixels in a computer monitor or dots-per-inch of a printer. It also refers to the amount of detail that can be discerned in an image from a weather satellite.
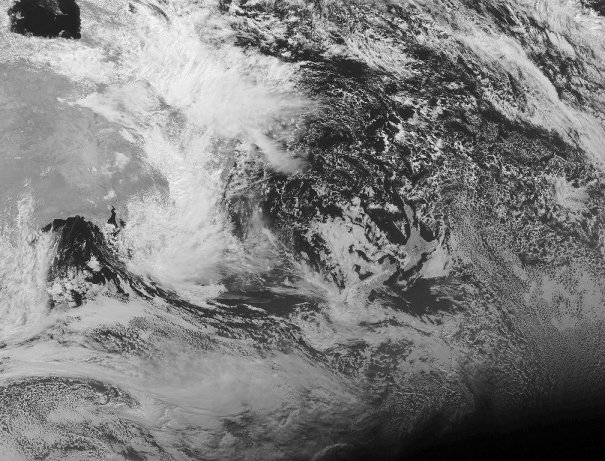
Take a look at the image below, based on visible light as received by the MtSat-2 geostationary meteorological satellite.
 MTSAT-2 visible satellite image for 3pm NZST Tuesday 10 July 2012. Image courtesy Japan Meteorological Agency.
The image covers a large area, and it shows patchy cloud over and around New Zealand. Because the image uses visible wavelengths of light, it shows all cloud as white or light grey, regardless of how high or low the cloud is. This differs from infrared images, the ones usually displayed on TV and on websites, which show high cold clouds more prominently than the lower (and warmer) clouds.
Central Australia is largely cloud-free, and there are variations in the shades of grey caused by the varying texture of the land surface there. Over Queensland there is cloud with a wispy, fibrous texture. This is cirrus, composed of ice crystals which give it this appearance. It’s not possible to see much detail in the cloud over New Zealand. Note that the southeast corner of this image is darkened, due to the setting sun there.
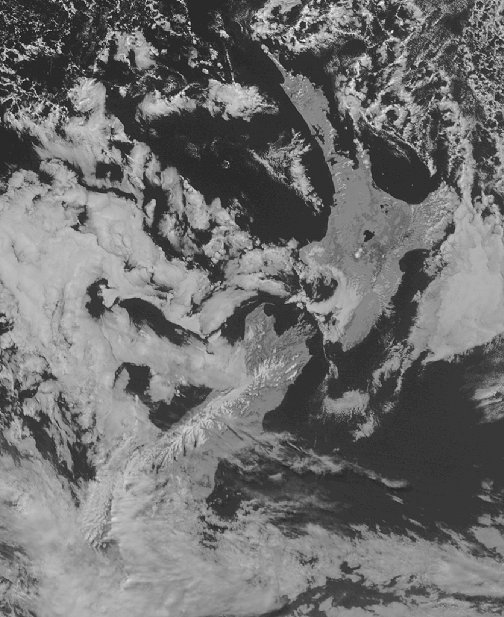
The same satellite can provide us with higher resolution visible imagery over New Zealand as below, valid for the same time as the previous image.
 MTSAT-2 NZ visible satellite image, same time as previous image. Image courtesy Japan Meteorological Agency.
We can now see that there’s quite a bit of cloud over Fiordland and Southland, and a few patches around north Westland, Manawatu and Wellington. Most of this cloud is at low-levels, typically stratocumulus and low-topped cumulus. Notice how the cloud seems to swirl around Farewell Spit and then towards the lower North Island. You might just be able to pick up a little of the structure of the few clouds that there are over Wairarapa.
The Aqua polar-orbiting satellite has a very high resolution sensor, capable of providing visible imagery to a resolution of 250 metres. Because this satellite orbits the Earth from Pole to Pole, the images are only available for places that the satellite passes over. Fortunately, Aqua passed over New Zealand at about the same time as the previous images, and I’ve reproduced the image below (converted to black and white to aid comparison). The richness of detail is striking.
 Very high resolution satellite image for approximately same time as previous images. Image courtesy of MODIS Rapid Response Project, NASA/GSFC.
Stratocumulus covers Manawatu, and transitions into a lumpier looking cumulus structure to the north near Wanganui. There is banding in the cumulus as it approaches the gap between the Ruahine and Tararua ranges, the area surrounding the Manawatu Gorge. The stratocumulus and cumulus cloud has been enhanced by the air having been forced to rise on the western (windward) side of the Tararua ranges (see post on Foehn wind). On the eastern (leeward) side the skies are mostly cloud free, indicating a sunny winter’s day.
The smaller Puketoi range east of the Gorge provides another smaller-scale environment for enhancing the cloud on the windward (western) side. The image also shows snow lying on the tops of the Ruahine and Tararua ranges.
The banding I talked about earlier is called “cloud streets”: the cumulus clouds are organised into longitudinal rolls by the low-level wind-flow. There’s further evidence of banding east and northeast of the Puketoi range, with curvature indicating the shape of the wind-flow as it exits the Gorge bottle-neck and spreads out. The resolution of this image is so high that you can see (or resolve) individual cumulus clouds as small white dots.