If you were in New Zealand in the mid '70s you may remember a particularly strong wind-storm that devastated many parts of the eastern South Island. It struck on 1 August 1975, doing a huge amount of damage to pine trees in the Eyrewell and Balmoral forests in particular. To give you an idea of the power of this storm, some of the peak recorded winds and gusts were:
mean wind (including gusts and lulls) strongest gust Christchurch Airport 126 km/h172 km/hTimaru Airport130 km/h165 km/hEyrewell Forest119 km/h170 km/h
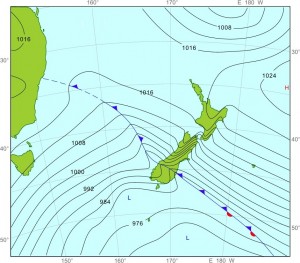
Compare these winds with the kinds of winds you hear about in most severe weather warnings these days. MetService issues severe weather warnings for widespread damaging winds when the mean speed is expected to reach 90 km/h or gusts to exceed 110 km/h. I recall this storm as a schoolboy in Christchurch, and the local radio station broadcasting that school was closed for the day. Looking out our front window I remember seeing a boy trying to cycle to school, barely able to stay on his bike. At lunchtime there was a short period of rain (from the cold front drawn on the weather map below), followed by a pleasant sunny afternoon with a gentle wind.
 Mean Sea Level analysis, 6am 1 August 1975
Because I was interested in meteorology even then, I thought about this storm, wondering why it was that Canterbury and Otago suffered most of the damage rather than Westland. Surely, I thought, the wind that had blown over the mountains must have come from upstream, so the wind must have been equally strong on the western side of the Southern Alps? But this was not so; the wind on the West Coast was only half as strong.
The fallacy in my argument was my implicit assumption that our weather and the forces that drive it are only two-dimensional (2-D). Perhaps we inadvertently reinforce a perception that our weather is 2-D by publishing lots of weather maps that are valid only at the Earth's surface (e.g., see Weather Maps). Rarely do we show what's happening higher up through the atmosphere or, more precisely, the troposphere - the part of the atmosphere that contains our weather.
It was the 3-D character of this storm that forced the damaging winds in Canterbury and Otago. Let me explain why. Firstly, we live in the mid-latitudes so most of our weather, especially high up in the troposphere, comes from between northwest and southwest (this is not always the case but it's generally true; for example, take a look back at the satellite loop in my previous blog post).
Secondly, we also know (see Mt Kaukau blog post) that the wind is usually stronger higher up. This effect was marked on 1 August 1975, when a northwesterly wind became very strong over the top of the Southern Alps. And finally, there was an area of low air pressure at ground level on the leeward (eastern) side of the Alps.
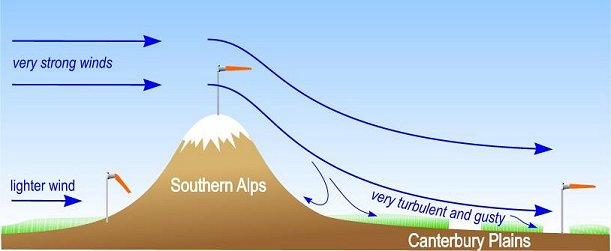
 Strong wind over the mountain tops descends on the leeward side.
These three factors together led to damage on the ground because the very strong wind aloft descended into the low-pressure area. It was this 3-D descending flow, and the turbulence that accompanied it, that did the damage in the Great Northwesterly Storm of August 1975. In my next post I will continue this thread by again looking at wind but from another perspective.