The photos in this blog were taken by MetService staff in August 2011.
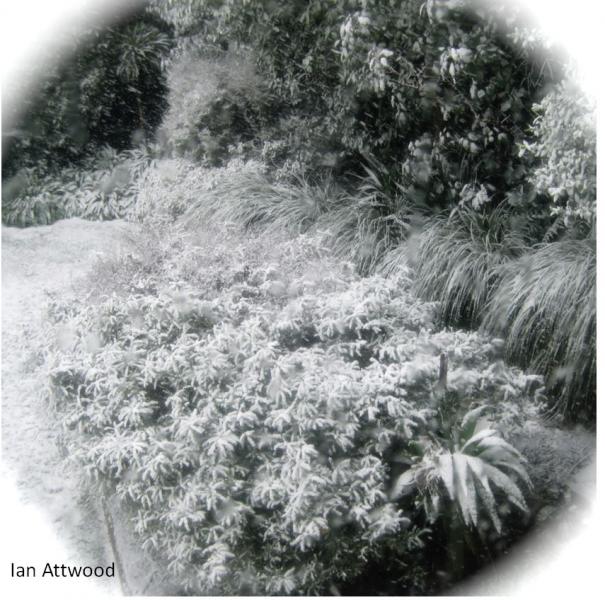
Photo taken by Ian in Karori, a western suburb of Welington.
We’ve just come out of a cold, snowy spell – the most significant of this winter so far. Ski fields nationwide are well topped-up, the Tararua range has been textured with snow after a pretty bare winter, and parts of the central North Island continue to suffer the effects of substantial snowfalls and drifts.
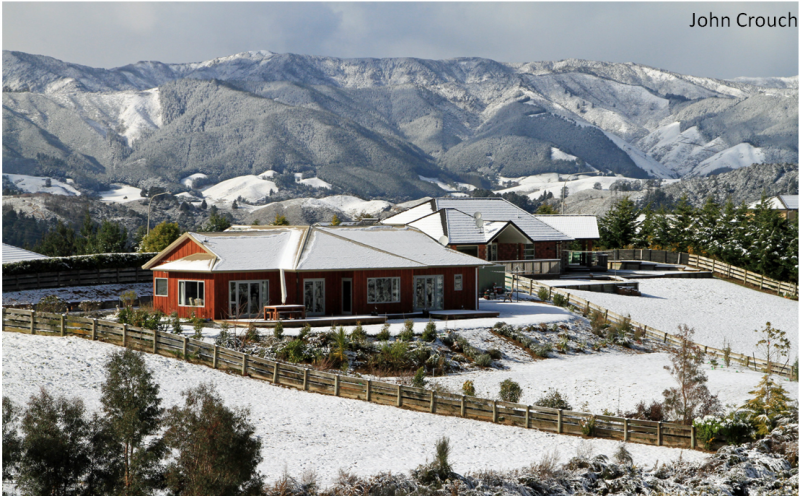
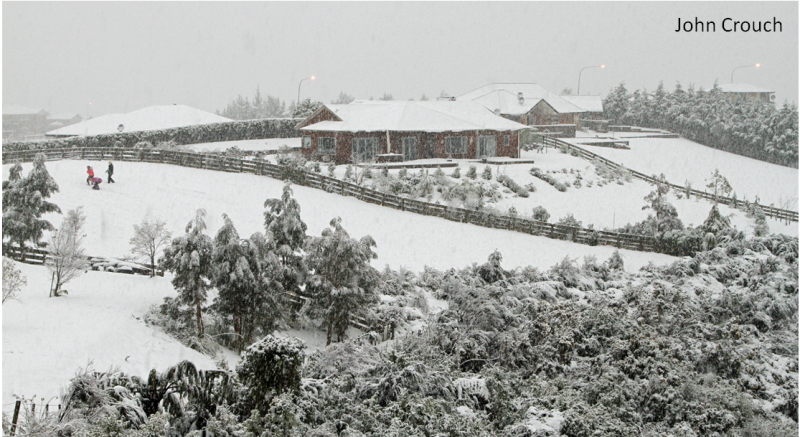
This photo and the following one were taken by John at Riverstone Terraces, Wellington.
Five years ago this week was a historic snow event, considered to once-in-a-generation for many parts of the country. What happened then, and how does it compare with the cold outbreak of August 2016? The impacts and meteorology of the 2011 event are covered in depth in the blog written by MetService's Chief Forecaster at the time, Peter Kreft: The Big Chill
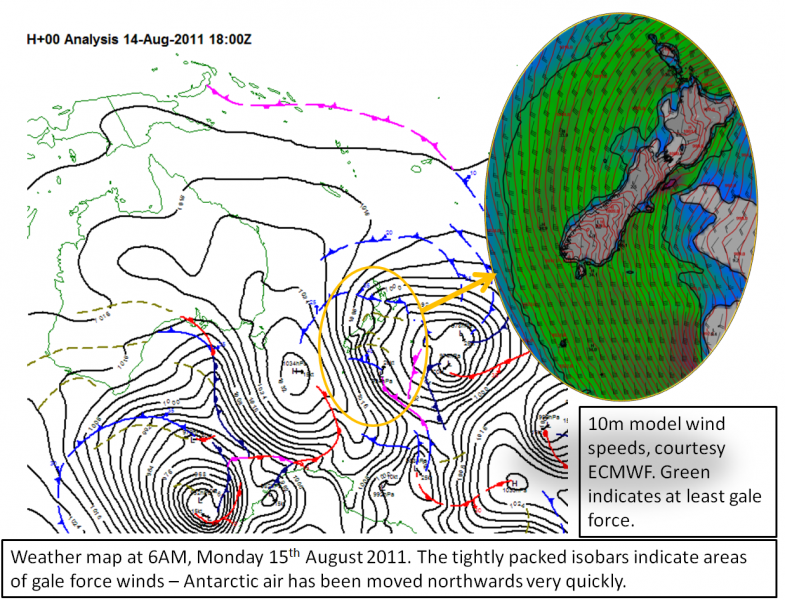
The snow event of August 2011 started on Saturday 13th, as a sequence of cold fronts moved onto the South Island. It took until the following weekend for the cold air to clear away completely from the country. The most severe weather occurred from the 14th till the 16th.
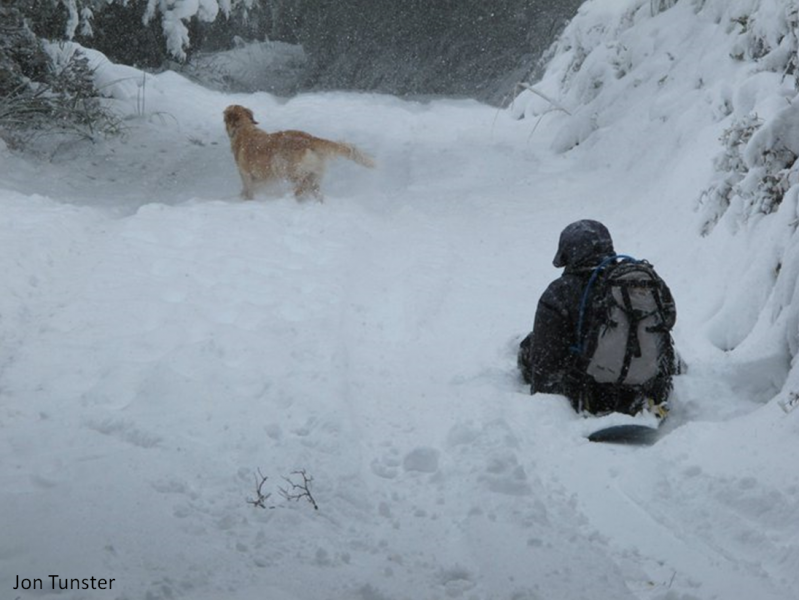
Photo taken by Jon on the upper reaches of Mt. Climie.
In Wellington, snowflakes were observed falling at sea level, with snow accumulating on the ground above 100 metres, which includes many suburbs. Not since 1976 had anything like this happened. At MetService, lead forecaster Peter Little - who lives in Karori and was unable to use the roads - had to don tramping boots at 4AM for a long walk into work across the new snowfields of the capital.
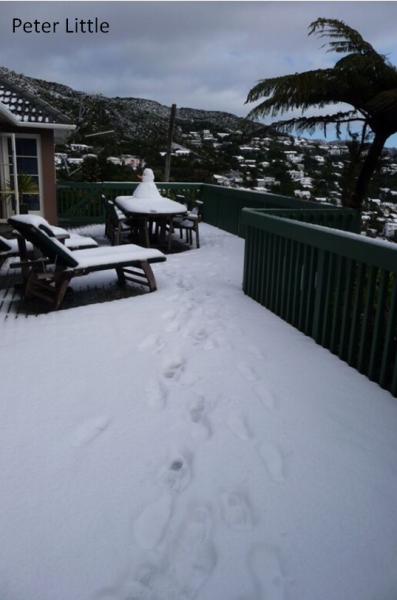 Photo taken by Peter in Karori.
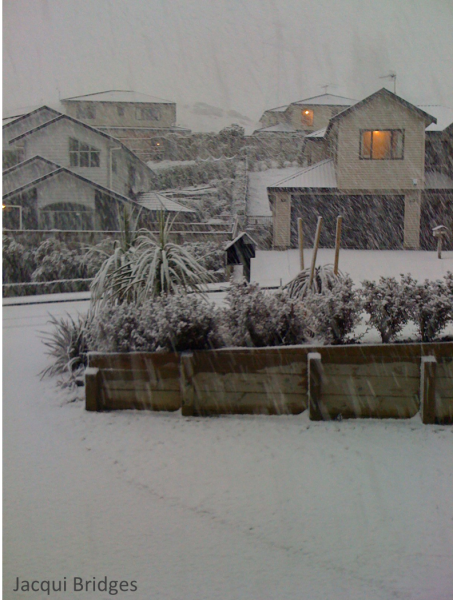 Photo by Jacqui Bridges.
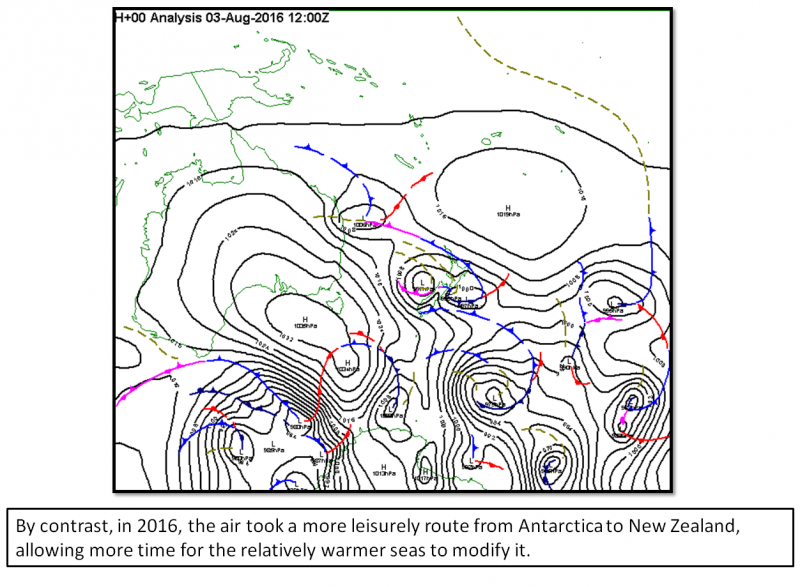
In August 2016, cold south to southeast winds developed across the South Island from the 3rd August, spreading onto the North Island over the following days. Late in the week and on the weekend, a low formed over the North Island, strengthening the southeast winds and providing additional moisture. The central North Island was in the firing line for several consecutive days, leading to major snow accumulations over the high ground. The Taupo marathon still took place, despite temperatures hovering only a few degrees above freezing.
The 2011 event was more widespread; snow fell to lower levels across more of the country compared with 2016. The snow level in Wellington was about 300-400m higher this year, which means that no populated areas were affected.
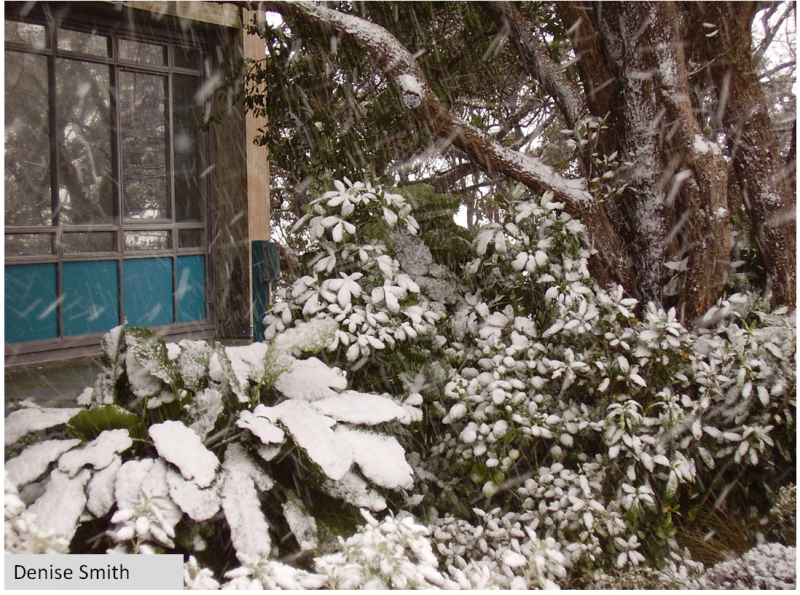 Photo by Denise taken at MetService building in Kelburn, Wellington.
The Meteorology of 2011 vs 2016
A few pictures can summarise the differences in meteorology for these events.
When trying to understand the weather, we need to look higher up in the atmosphere and not just at the surface. Meteorologists use “standard levels” and one of these is at 250hPa, or close to 10,000m high. It’s close to where aeroplanes cruise. Just like how we look at weather maps for the surface, we can do the same for this level.
Although we’re used to seeing large areas of high pressure and deep lows in surface weather maps, conditions at 10,000m are usually dominated by westerly winds, with passing troughs and ridges. This is why lengthy spells of cold weather are rare in New Zealand – the westerlies keep our weather mobile. It’s quite rare to see closed areas of low or high pressure. When this does happen, it usually signifies “blocking” conditions in the atmosphere, which has a major effect for us at the surface – things don’t move very quickly and “the same type of weather” happens across several days. It also increases the chances of unusual weather.
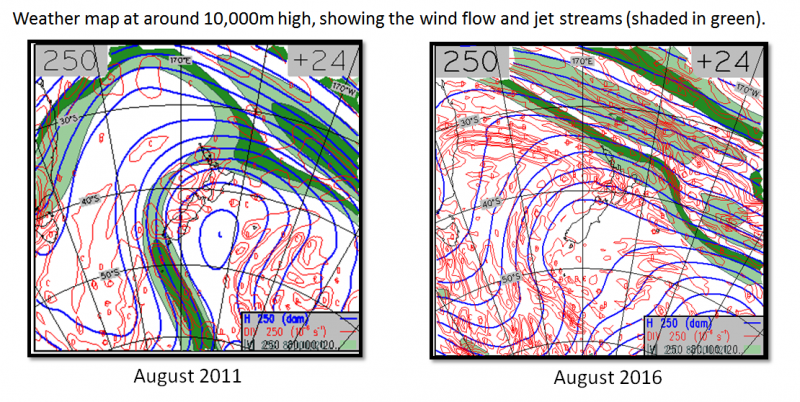
We can see above the closed low pressure centre near New Zealand in August 2011, along with a strong southerly jet stream moving onto the South Island. That jet stream was very deep in atmosphere, extending almost to the tops of the Alps; delivering extremely cold Antarctic air to New Zealand both at the surface and higher up.
In 2016, the situation was not so extreme. However, the jet stream to the north of the North Island was an important factor in the low pressure forming at the surface and enhancing snowfall across the central North Island.
After analysing the upper atmosphere, we move onto the surface. Highs and lows, isobars and fronts. Everything is a bit more familiar:
So we can see that the differences between August 2011 and August 2016 were found both at the surface and higher up in the atmosphere. There are so many factors that determine how much snow will fall, and how low it will fall. It’s one of the more challenging aspects of forecasting. The analysis here is just a very brief summary, but it helps us appreciate just how unusual the 2011 event was for New Zealand.
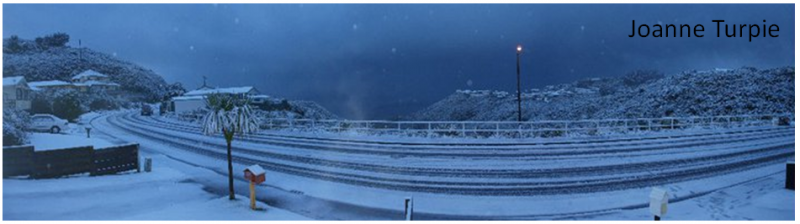
Photo taken by Joanne at Woodridge looking east towards Eastbourne.