A Significant Snow Event diary
2:30pm Sunday 14 August 2011
It's early days in a weather event which is likely to be memorable for its coldness. Below is a satellite image for midday Sunday. The wind flow over New Zealand is generally from the southwest; the coldest showery air has made its way onto Fiordland, Southland, Otago and south Canterbury. It's not raining or snowing over all of southern New Zealand because the wind flow is more or less lined up with the South Island, thereby sheltering some places, and because the precipitation is showery.
 Infra-red satellite image for midday Sunday 14 August 2011. Image courtesy Japan Meteorological Agency.
The surface temperature doesn't necessarily tell the whole story. Below is a graph of the air temperature for the 24 hours from 1:00pm Saturday 13 August to 1:00pm Sunday 14 August. Note how the air temperature at Invercargill Airport and Nugget Point, both fairly open to the southwest, has been on a pretty steady downward trend.
At 2:00pm Sunday, the temperature at Nugget Point was 1.0 C and the wind speed was 85 km/h. Brrr. At Timaru Airport, on the other hand, the temperature rose sharply when the southwest change arrived mid Sunday morning - the reverse of what might be expected.
The period overnight Saturday to dawn Sunday at Timaru Airport was one of clear skies and fairly light winds, so the quickly-cooling land surface during this period cooled the air immediately above it and an inversion formed. When the southwest change arrived, the air once again became well-mixed. But this southwest air is expected to also become steadily colder.
 Air temperatures at Invercargill Airport, Nugget Point (Otago coast) and Timaru Airport for the period 1:00pm Saturday 13 August 2011 to 1:00pm Sunday 14 August 2011.
4:15pm Sunday 14 August 2011
Here's another look at why the surface temperature doesn't necessarily tell the whole story. In my blog post about the winter storm of early July 2011, I partially explained how showers may form in cold air moving over a warmer sea surface. The (relatively) warm sea heats "blobs" of the air immediately above it; these blobs then ascend because they are less dense than surrounding air. For the ascending process to continue, the surrounding air must remain relatively cooler than the ascending warm blobs. Thus, it is important to have information - that is, observations and forecasts - about the vertical temperature structure of the atmosphere.
Observations of the temperature structure of the atmosphere are primarily made using weather balloons. Below is a graph of the temperature at three levels in the atmosphere above Invercargill, obtained from radiosonde balloon flights. The blue line is the temperature at about 5000ft, the red line is the temperature at about 10000ft, and the green line is the temperature at about 18000ft. These heights are approximate; the height of a given pressure level varies with the air temperature; here, we should probably discuss the idea of the thickness of an atmospheric layer - but I think we'll do that some other time. Anyway, the graph shows that the atmosphere above Invercargill has been cooling off steadily since the middle of Saturday 13 August. In depth, it is now very cold.
 "Upper air" temperatures obtained from balloon soundings at Invercargill Airport at midnight Fri-12-Aug, midday Sat-13-Aug, midnight Sat-13-Aug and midday Sun-14-Aug.
6:15pm Sunday 14 August 2011
It snowed quite heavily in Wellington City, above about 100 metres, from approximately 4:30pm for at least an hour. This is the heaviest and most widespread snowfall in Wellington City for at least 30 50 years.
 Snow in Clifford Road, Johnsonville (altitude approximately 200 metres) early evening, Sunday 14 August 2011. Snow depth 3 to 5 cm.
At midday Sunday 14 August the freezing level around Wellington, obtained from the Paraparaumu radiosonde balloon flight, was just over 1000 metres and falling (it was around 1600 metres at midnight Saturday 13 August). But late on Sunday afternoon, it would still have been well above the level to which snow fell in Wellington.
Snow starts melting once it falls below the freezing level – but the melting process draws heat from the surrounding air, which lowers its temperature; thus, the melting snow “drags” the freezing level down with it, at least for a while. How far the freezing level within the area of falling snow is dragged towards the ground depends mostly on the intensity of the snowfall and the vertical variation of temperature and humidity of the air it is falling into.
 Wellington radar image, 5:05pm Sunday 14 August 2011.
1:00pm Monday 15 August 2011
So far in this blog, I've been talking quite a bit about the temperature throughout the depth of the troposphere (the troposphere is the part of the atmosphere in which weather systems exist). Time, now for a picture. Below is a plot of:
-
Forecast temperature (colours) at the 500 hPa level (roughly 18,000 ft, or about halfway up the troposphere)
-
Forecast wind speed (black lines) at the 250 hPa level (near the top of the troposphere)
... for midday Monday 15 August.
Plot of (a) forecast temperature (colours) at the 500 hPa level (roughly 18,000 ft, or about halfway up the troposphere), and (b) forecast wind speed (black lines) at the 250 hPa level (near the top of the troposphere), for midday Monday 15 August 2011. Data courtesy European Centre for Medium-Range Weather Forecasting.
The colours in this plot are forecast temperature; over most of New Zealand, the temperature at around 18,000 ft was forecast to be -30 C or lower.
The important thing to note is that a large mass of Antarctic air covers almost all of New Zealand. The red arrow on this plot shows the forecast position of the axis of strongest winds, near the top of the troposphere, at midday Monday 15 August.
This is the polar jet, on the border between the deep pool of Antarctic air over New Zealand and the warmer mid-latitude air around it. Incidentally, the forecast temperatures compare very well with the observed temperatures at midday Monday 15 August, as shown in the table below.
500 hPa temperature (°C) @ midday August 15
Forecast Observed
Whenuapai -29.3 -29.9
Paraparaumu -38.9 -39.1
Invercargill -34.4 -35.1
4:30pm Monday 15 August 2011
Here's a graph of how the freezing level over New Zealand has changed over the last few days. As of midday Monday 15 August, the freezing level varied between about 1000 ft at Invercargill to about 2000 ft at Whenuapai. Snow has fallen to sea level in many parts of southern and central New Zealand - that is, to at least 1000 ft below the freezing level.
This is a classic example of the melting effect (see the post made at 6:15pm Sunday 14 August 2011, above). Over the last few days, MetService's Severe Weather Forecasters have spent a lot of time considering how far below the freezing level snow would fall. This requires a good understanding of cloud physics.

Freezing levels at Whenuapai, Paraparaumu and Invercargill from midnight Friday 12 August 2011 to midday Monday 15 August 2011, derived from radiosonde flights.
9:30am Tuesday 16 August 2011
Here's a few photos from the Wellington snow of June 1976.

Wellington snow of June 1976: looking approximately southwest from the MetService building.

Wellington snow of June 1976: Karori Road, looking southwest.

Wellington snow, June 1976: MetService building, from Salamanca Road. Look at those cars ...
10:30am Tuesday 16 August 2011
In southerly flows, the West Coast of the South Island is well sheltered by the Southern Alps. Since the southerly took hold on Sunday, the air on the West Coast has been very dry because of the Foehn Effect. Below is a graph of the dew point temperature (the temperature which air must be cooled to for water vapour to condense into water liquid or water solid) at Hokitika Airport from 10am Sunday 14 August to 10am Tuesday 16 August.
On the afternoon and evening of Sunday 14 August, there's a huge change in dew point (around 13 degrees), down to around -10 C. Since then, the dew point has remained negative, generally fluctuating between about -3 C in the morning and -7 C in the afternoon. Such a low dew point makes the air feel much colder than its temperature would suggest. We take the dew point into account when calculating the "feels like" temperature.

Dew point temperature at Hokitika Airport, 10am Sunday 14 August 2011 to 10am Tuesday 16 August 2011.
2:30pm Tuesday 16 August 2011
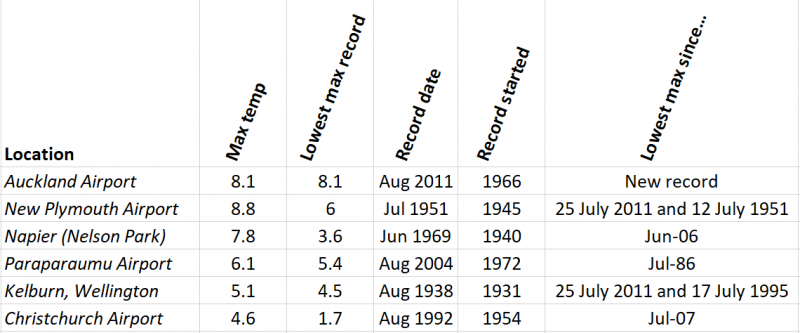
This event has been characterised by many places having low daytime (maximum) temperatures.
Monday night / Tuesday morning was very cold in some places, though. Here's a few notable overnight minima from MetService automatic weather stations.
Waiouru Automatic Weather Station -7.7 C (new record for August)
Blenheim Airport Automatic Weather Station -6.2 C (new record)
Rotorua Airport Automatic Weather Station -5.2 C (equals record)
Taupo Airport Automatic Weather Station -5.1 C
5:00pm Tuesday 16 August 2011
Below is a plot of where the air arriving at an altitude of 500 metres above Auckland at midday Monday 15 August came from. Four days previously, it was over the Antarctic landmass; two days previously, it was still over the Antarctic sea ice. The Antarctic sea ice edge is close to its northern-most extent and is near latitude 60 degrees South. Thus, the air arriving at Auckland passed very quickly over the relatively warm ocean between the Antarctic ice edge and New Zealand. In contrast, the air from the Southern Ocean which arrived over Auckland on Saturday 9 July (see my blog post on the stormy period of early July 2011) had travelled over a much longer stretch of ocean, over a longer period of time, and consequently was warmer and moister.

"Backward trajectories" of the air at 500 metres above mean sea level arriving at Auckland midday Monday 15 August 2011. The red line traces the path of the air over the period from midday Friday 12 August to midday Monday 15 August. Triangles denote the location of the air mass at 12-hourly intervals. Data courtesy NOAA Air Resources Laboratory.
6:00pm Tuesday 16 August 2011
As of 2:00pm Tuesday 16 August 2011, the extent of snowfall in this storm is as shown in the image below.

The scalloped areas delineate where significant snowfall is known (or believed) to have occurred. The dashed areas delineate where lesser amounts of snow have been observed and where little or no snow is believed to by lying. The period is from the beginning of the event on Sunday 14 August 2011 to 2:00pm Tuesday 16 August 2011.
4:00pm Wednesday 17 August 2011
During the next few days, while an anticyclone advances onto the country, the general wind flow will decrease in strength and the depth of cloud along eastern coasts gradually reduce. Near sea level the air over New Zealand remains very cold, and the advancing anticyclone more or less "traps" it in place. Very cold air, clear skies and light winds overnight are a recipe for hard frosts.
Hopefully, the diagram below - known technically as a tephigram - helps illustrate this. It is a plot, in the vertical, of the air temperature and the dew point temperature derived from the radiosonde balloon flight at Invercargill at midday Wednesday 17 August.
At Invercargill there is already a large mass of sinking, warming (and drying) air above about 5000 ft (see text in red on diagram). This sinking air presses on the (relatively) colder air beneath it, trapping it near the Earth's surface.
In this particular case, the zone of transition between the two different air masses is known as a subsidence inversion. I've marked the subsidence inversion on the diagram; it's the broad blue horizontal bar near the bottom. The very cold air trapped below about 5000 ft at Invercargill is much less inclined to move around than the air further up in the atmosphere. As I've explained above, this is partly because of the advancing anticyclone. But it's also partly because cold air is less "runny" than warm air. (Treacle flows much more readily when warm than cold).
On the right of the diagram below are the winds in the vertical, as they were above Invercargill at midday Wednesday 17 August. Clearly (see text in green on diagram), the one wind barb shown below 5000 ft indicates quite a different flow from all the winds above 5000 ft: the flow near the surface has become decoupled from that above.

Invercargill tephigram for midday Wednesday 17 August 2011.
In a general sense, this vertical temperature and wind structure is expected to spread over eastern parts of New Zealand during the next few days as the anticyclone moves closer and pressures over the country rise.

 Forecast surface pressure field for midnight Wednesday 17 August 2011.Forecast surface pressure field for midnight Thursday 18 August 2011.
3:30pm Friday 19 August 2011
Finally today, cloud over the south of the South Island has cleared enough to reveal the extent of snow cover there. Below are two visible satellite images. The first is for around 10:00am on the morning of Wednesday 10 August, some days before this extraordinary cold outbreak. The second is for around 10:00am on the morning of Friday 19 August. Nearly all of the white over Canterbury, Otago, Southland and Fiordland is snow. The imagery only shows the extent of the snow, not its depth.

Before: MODIS-Terra visible image for about 10:00am on Wednesday 10 August 2011. Data courtesy NASA/GSFC, Rapid Response.

After: MODIS-Terra visible image for about 10:00am on Friday 19 August 2011. Data courtesy NASA/GSFC, Rapid Response.