Resolution counts
Weather forecasting is basically an ‘initial value problem.’ This means that if weather models could capture the current weather perfectly i.e. correctly initialise the current state of the atmosphere, then in theory, they could forecast the future weather accurately well beyond the present limit of a week or so. After all, the atmosphere is a fluid, and follows strict laws of physics.
Resolution counts, because it improves initialisation. If a weather model cannot ‘see’ the current detail of a weather system well, then it can‘t forecast it well, either. Figure 1 shows an example of what a Tropical Cyclone ‘looks like’ at varying resolutions.
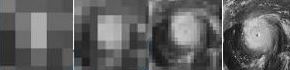 Figure 1: Using a Tropical Cyclone to illustrate resolution.
Satellite observations (images) of the tropical cyclone are shown, at varying resolutions. From left to right: 210km, 63km, 25km, 0.5km.
But even with recent advances in resolution, today’s weather models still contain errors when estimating the current state of the atmosphere. These errors grow larger and larger over time, and the weather forecast skill deteriorates. We cannot run a single weather model out indefinitely in time – at some point the forecasts become useless (inaccurate).
Ensembles
Luckily, there is another way of using weather models to gain skilful ‘big picture’ weather information in the 2-4 week window.
Since we don’t know the size of the error that a single model has when it tries to capture the current weather (does it have the Low central pressure too high? Too low? Is the Low located too far north? Too far south?), we use a group of weather models instead (say, 50 of them). This is known as an ensemble approach.
We ‘wiggle’ the models around at the start of the forecast, to ensure that they all initialise slightly differently. That is, we make sure some of the models have the Low too deep, and some too shallow, some too far north, or too far south. And then we let them run out in time, for the next few weeks….
We will find out if the initial state matters as to where the Low ends up - it may not. We will find out if the models roughly end up with the same storyline across the coming few weeks, or whether there is a large spread in the possible future weather. Of course, the models will diverge in the detail for each individual front A, High B, Low C…. But what if they all park the Highs in roughly the same spot? What if most models keep a cool southerly regime feeding in over New Zealand over an extended period? We are looking for ‘big picture’ information when we use ensembles.
Using ensemble information
An example of how ensembles are used is shown in Figures 2 and 3. These maps show forecasts of weekly rainfall and temperature anomalies (deviations from normal for the time of year). The first week is characterised by prevailing northwesterlies. The forecast was for an extremely wet week, overall, on the West Coast, with drier conditions along the east coast of the North Island. Weekly temperatures were expected to be well above average along the entire east coast of both Islands. These predictions are consistent with the usual effects seen during northwesterly events.
High pressure was expected over the Tasman Sea the following week, with prevailing southerly flow across New Zealand. An unusually cool and dry week was predicted across the country (Figure 3), the exception being the eastern South Island, where closer to normal rainfall totals were forecast.
While ensemble guidance offers no information around which particular days are likely to be hot or cold, wet or dry, this type of weekly information can prove very useful from an on-orchard planning point of view. You might choose very different activities in the first week, compared to the second. For more information about ensemble forecasts, you can contact MetService at enquiries@metservice.com.
 Figure 2: Forecast weekly rainfall anomaly (left) and temperature anomaly (right), for Monday 21 November – Sunday 27 November 2016.
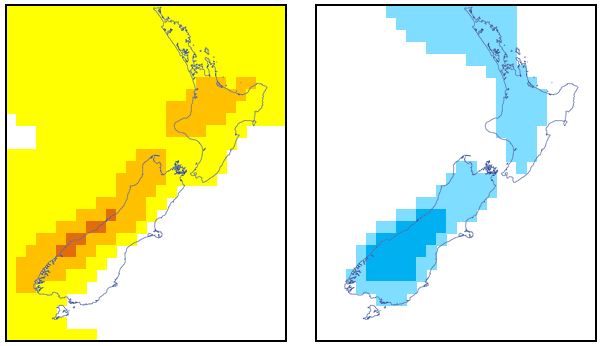 Figure 3: Forecast weekly rainfall anomaly (left) and temperature anomaly (right), for Monday 28 November – Sunday 4 December 2016.