This blog post is the third in a three-part series discussing verification of MetService forecasts. Here, we present the method used for verifying Severe Weather Warnings, along with some recent examples.
Verification Scheme
The statistical method of verifying Severe Weather Warnings is similar to that used for verifying rainfall in city forecasts. That is, a categorical approach is taken, with Probability of Detection (POD), False Alarm Ratio (FAR) and Critical Success Index (CSI) being produced on a monthly basis. In the case of Severe Weather Warnings, POD, FAR and CSI are expressed as percentages. There is, however, much more subjectivity in determining whether a Severe Weather Warning is a success, a false alarm, or whether an event has been missed. This is because Severe Weather Warnings apply to broad areas (minimum of 1000 square kilometres, and generally much larger than that) and an assessment has to be made of how widespread the occurrence (or non-occurrence) of heavy rainfall / heavy snowfall / strong winds was.
The initial assessment is made by MetService's Severe Weather Forecasters themselves, using all available weather observations (including those from many voluntary observers MetService can call), media reports, comments on web forums about New Zealand's weather, radar rainfall accumulations, and occasionally through discussion with territorial authorities and utility companies. At the end of each month, every assessment of every event is reviewed by two senior meteorologists who work at MetService and who are outside of forecasting operations, and I sign off on them as Chief Forecaster. Rainfall, snowfall and wind are usually highly variable over any broad area in New Zealand – because of the complexity of the New Zealand landscape and because of the variability of weather systems themselves. For example, if the Severe Weather Warning is for 150mm rain in 24 hours, is it successful if:
- The rain fell in 30 hours? 18 hours?
- 200mm fell? 100mm? …
- 250mm fell over half the area and 50mm fell over the other half of the area?
Performance over the year to September 2010


Longer-Term Trends
Graphs like those above but covering a much longer period – say, a decade – show a gradual improvement in forecast accuracy. Given the changes in observing technologies, numerical weather prediction and forecasting techniques over the last several decades, this is not surprising. What these verifications don’t show well is the much increased precision – location, amount, intensity, timing – that Severe Weather Warnings have contained in recent years.
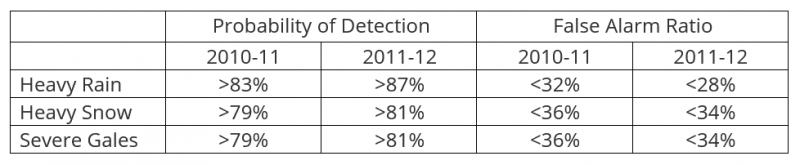
Performance Target
MetService's performance targets for Severe Weather Warnings are:
Limitations
It is possible to have a “perfect” POD or FAR – but not simultaneously:
- If heavy rain (or heavy snow, or strong winds) was forecast every day, the POD would be 100% - but the FAR would be close to 100% too.
- If heavy rain (or heavy snow, or strong winds) was never forecast, the FAR would be 0% - but the POD would be close to 0% too.
In both of these cases, the forecast would be of no value because users would have no idea on which days heavy rain (or heavy snow, or strong winds) was expected to occur. Very few forecasts or warnings are issued in isolation. Therefore, verifying them in isolation does not provide a complete picture of their value. Not infrequently, MetService will issue a Severe Weather Watch if it is considered that an event will not quite meet the Severe Weather Warning criteria but is nevertheless notable. If, subsequently, the Severe Weather Warning criteria are met, the verification scheme will record a missed event – despite MetService having perhaps come very close to forecasting it perfectly.