It may seem obvious. Weather is what we experience locally day-to-day and week-to-week, while climate is a background signal sitting ‘behind’ the weather, observed at the seasonal, annual or even decadal time scale. But the interplay between what is dominate in the short-term and what prevails in the longer run, is not so straight forward. For example, 2015 was a very dry year for regions in the north and east of both islands of New Zealand. But there were rain events in these areas, and some of them were very heavy. For example, Nelson recorded its third driest year on record in 2015 (with an annual rainfall total of around 650mm, a full 300mm short of the average) – and yet significant rain fell on the 1st and 2nd of June.
January 2016 was also a notable example of how local weather in the New Zealand region affected what rain we got in the gauge more strongly than underlying climate features such as El Nino. In this blog, we’ll discuss reasons why many parts of the country saw significant rainfall during January, and whether this trend might continue.
Large-scale climate patterns
Climate patterns are seen over large geographical areas, to match their longer time frames. For example, El Nino affects the tropical Pacific Ocean, and its effect on equatorial sea temperatures is so large it can be seen from space (Figure 1). The so-called El Nino ‘warm tongue’ was extremely strong at the event’s peak in late 2015, with sea temperatures peaking at nearly 3 degrees Celsius above average along the central equator.
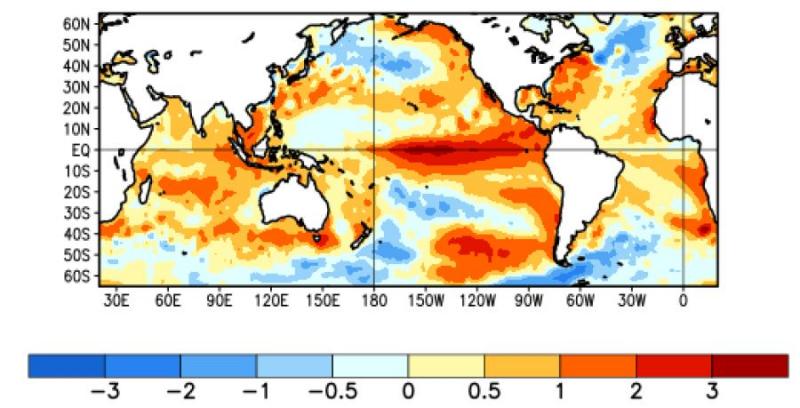
Figure 1: The sea surface temperature deviation from normal shown over the last four weeks (10 January – 6 February 2016). Image courtesy of NOAA NCEP Climate Prediction Center. Red colours show seas that are abnormally warm for the time of year (the warm tongue is very obvious in the centre of the picture), while blue colours depict seas that are cooler than usual. The temperature deviation scale is shown at bottom (in degrees Celsius).
Southern Ocean storms strongly affect New Zealand climate in winter and spring. Storm track oscillations are also very large, affecting much of the southern hemisphere high latitudes. In contrast, weather features tend to be smaller (lows, highs, fronts and thunderstorms) and have much shorter life spans.
The background climate state often modifies weather patterns, reinforcing or diminishing the short-term weather features. An obvious example is sea temperature changes related to El Nino, which can influence Tropical Cyclone formation and intensity. Or consider when Highs rule the roost over the country over a period of several months. Intermittent fronts can, and do, move across New Zealand during a prevailing high pressure regime, but they are typically weak and are not good rain makers.
Global climate patterns important to us:
- El Nino ( explained)
- The Madden-Julien Oscillation (a pulse of rainfall that circles the tropics every 30-60 days)
- Southern Ocean storms (known as the Southern Annular Mode)
Local weather patterns that can affect us:
- Blocking Highs over or to the east of New Zealand
- Tasman Sea Lows
- What’s happening in Australia*
* The extreme heat seen in eastern regions of New Zealand during December 2015 was in part 'left-overs' from our neighbour’s heatwave. Thanks a lot, Australia ...
Local weather in control during January 2016
If several climate/weather features are in play at any one time, they can add together, or cancel each other out. Sometimes, the local weather patterns in New Zealand will ‘trump’ the background global climate state as to how much rain ends up in the gauge.
As mentioned, January 2016 was a good illustration of the difference between weather and climate. It was a relatively wet month for many regions of the country, occurring in what has been an extended dry period across many parts of New Zealand.
If we have a look at the ‘average weather map’ over the period in which the background El Nino has been present (July 2015 – January 2016), we see a standard El Nino response (Figure 2). That is, we have seen more highs over the Tasman Sea and extending onto New Zealand than normal, with more southwest to southerly winds than usual over the country.
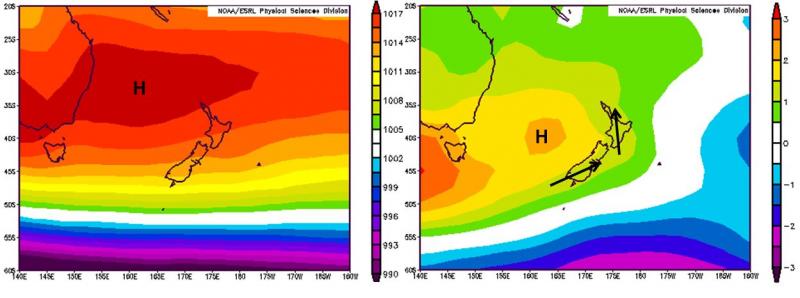
Figure 2: The average weather map over the last 7 months (on left), for July 2015 to January 2016. The weather map deviation from normal is also shown for the same period (on right). This shows pressures over the Tasman Sea and New Zealand have been higher than normal (orange and yellow colours). The black arrows show more southwest and southerly airstreams than usual.
Examining the ‘average weather map’ for January 2016 shows a sharp contrast (Figure 3). The Highs lost their grip over the central Tasman Sea during January. Notably, lower pressures were evident around the north of the country, resulting in more frequent than usual northeast winds over the North Island. This helped feed down humid, subtropical air masses, so that rain bands were able to produce significant rainfall. Another mechanism for a ‘wetter’ month was the expansion of relatively warm seas down towards the North Island (have a look back at Figure 1).
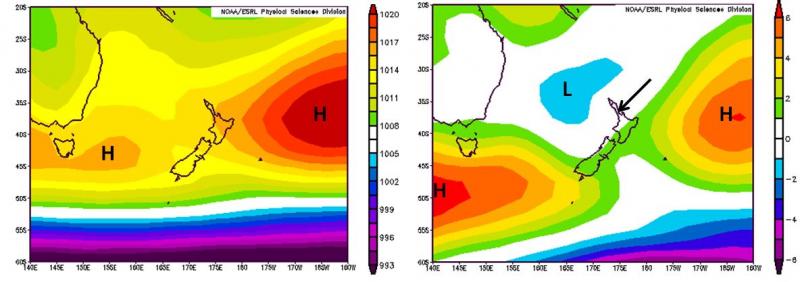
Figure 3: The average weather map for January 2016 (on left). The weather map deviation from normal is also shown for the month (on right). This shows lower pressures than normal near the north of New Zealand (blue colours), with a large blocking High well away to the east of the North Island (orange colours).
In summary, we see a large difference in the weather patterns occurring at the 30-day time scale, versus what has been going on at the longer (multi-month) climate window.
Looking ahead
The big question, of course, is whether this is simply a short-term blip away from the usual El Nino climate pattern here, or whether local patterns will continue to dominate our rainfall. In the short-term (i.e. during February), further lows from the north look likely. The warmer than normal sea temperatures around northern New Zealand should also continue to play their part, feeding in useful moisture and warmth to incoming rain bands. These sea temperatures are also likely to influence our air temperatures over the longer-term, with a mild autumn the current thinking.
Although El Nino has now passed its peak and has begun its gradual decline (Figure 4), it remains a strong event on the global climate stage. Climate model projections show a gradual easing of the El Nino back to neutral levels during the autumn. However, we may see a modest resurgence back to Highs prevailing over the central Tasman Sea over the longer-term (the coming few months).
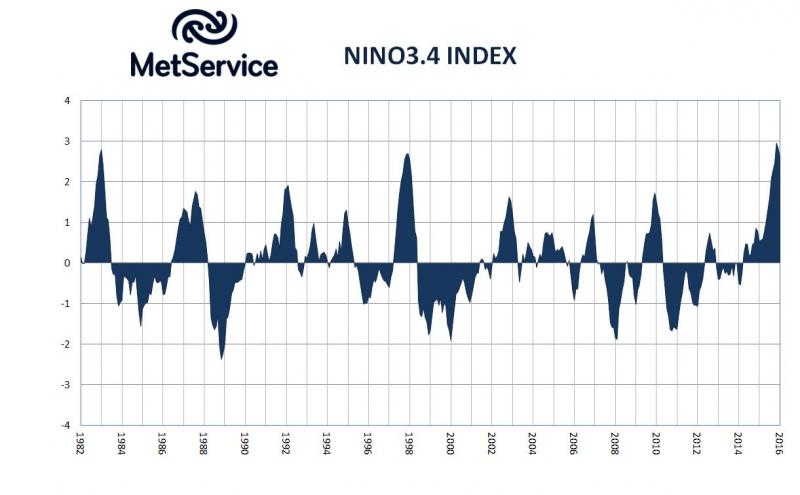
Figure 4: The NINO3.4 Index is an oceanic measure of the El Nino Southern Oscillation climate pattern (it measures the ‘warm tongue’). It indicates the sea surface temperature deviation in the region 5°S to 5°N, 170°W to 120°W. Monthly values are shown for the period January 1982-January 2016. Sustained positive values indicate El Nino conditions.
The bottom line is that the New Zealand farmer with current dry conditions may not be out of the woods just yet. In the short term (i.e. February), it looks like further rain relief is in sight for some regions of the country. But we still have to get through what is traditionally a rather dry and warm time of year.
For the farmer trying to make short-term decisions (shall I make hay this week?) or considering longer term options (should I de-stock?), monitoring both weather and climate features is essential. The weather map, weather forecasts and weather models provide good guidance in the short term. With respect to longer-term guidance, MetService meteorologists routinely monitor the climate state, and provide expert commentary to clients about what is currently going on both globally and locally. You can access MetService climate commentary and our four week forecasts at http://www.metservice.com/rural/monthly-outlook.