Written by Bob McDavitt, Meteorologist
August 2011's polar outbreak was a major weather event that drew media interest from around the world. This event was notable in recent history, in terms of the coldness of the air and extent of its spread across New Zealand. During the week of the 'big chill', MetService's Chief Forecaster kept up an in-depth explanation of the polar outbreak as it happened. Behind every forecast is a lot of work. The starting point for an accurate forecast is an accurate representation of the atmosphere’s current state. This is why MetService operates extensive observing and weather modelling programmes and runs a large 24/7 forecasting operation. For much more about this, see the blog on MetService's Investment in Forecasting. The 5-day rain forecast on metservice.com is very useful for planning purposes, with the maps showing pressure, direction and strength of wind, and where rain is expected to fall. The forecast is in the form of a series of maps, which are also provided in a player, so you can animate the series of maps to see how the situation could change over the period of time.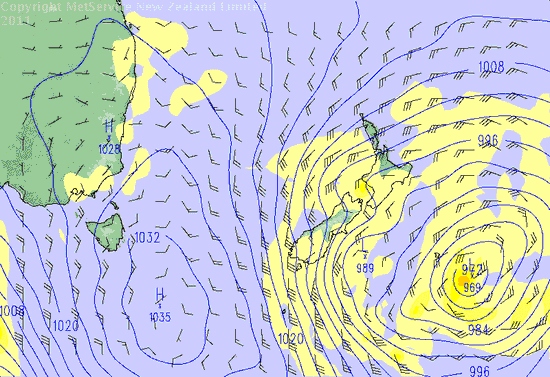
Rainfall (yellow shades) as forecast in the six hours from 6:00pm to midnight Sunday 14 August
Forecast wind speed and direction (barbs) at midnight Sunday 14 August
MSLP Mean sea level pressure (blue lines) for midnight Sunday 14 August, as displayed on metservice.com on Friday 12 August.
Our 3-day model provides a closer look at New Zealand. On these charts, the thick purple line is a guide to where precipitation may fall as snow.
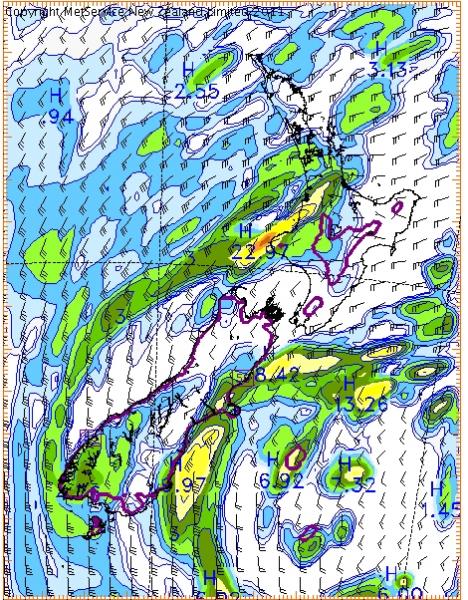
Rainfall (shaded) as forecast in the three hours from 9:00pm to midnight Sunday 14 August
Forecast wind speed and direction (barbs) at midnight Sunday 14 August, as displayed on www.metservice.com on Friday 12 August.
Snowfall is likely in the coloured areas enclosed by the thick purple line.
However, computers deal only in numbers and don't give the complete story - this is where human expertise comes into play. Trained forecasters do things that weather models cannot, for example:
-
Consider, in real time, conflicting information – from models and observations – and determine which outcomes are more likely, based on an understanding of the weather situation
-
Steer a steady course when the model forecasts are “jumping” from run to run
-
Reconcile observed and forecast weather and recognise when the forecast needs changing (regardless of what the models say)
-
Explain the weather, particularly to those who are managing weather-related risks (people talk to people; computers talk to computers)
It is vitally important for forecasts (and updates as they happen) to be communicated in a measured, timely and credible manner. On Wednesday 10 August, days before the outbreak, MetService published a media release and contacted farming organisations, to alert those with a real need to plan in advance about what forecasters were anticipating. Snow and cold would have a large impact to farmers in the lambing and calving season so this was highlighted in the news release.

Severe Weather Outlook map issued at 1:43 pm on Thursday 11 August.
To ensure that all sectors of New Zealand were kept up to date, a Special Weather Advisory was also issued (click here to see pdf) on Thursday 11 August. This is a special news release that draws people's attention to particularly significant or widespread weather to come. On Friday 12 August another media release was issued to give a further update on the developing polar blast. Because of the chaotic nature of the atmosphere (and the variation of predictability with time), the forecast for a given day (or time) in the future can change as we get closer to it. This is why the forecast issued on a Monday for the weekend to come might be very different to the forecast issued on, say, the Thursday of the same week. In the days that followed Friday 12 August, Severe Weather Watches and Warnings (click here for a detailed account - a pdf document) were issued and updated as conditions warranted. As more data became available, site-specific urban forecasts were updated to include the risk for snow.

Mean sea level analysis for midnight Sunday 14th August, near the beginning of the coldest period during this event.
Snow fell in episodes over several days. There were some notable snow amounts - and reports of snow in places that had not seen it in a very long time.

Snow map showing reports of the depth of snow (in centimetres) from various parts of the country, during the event.
This polar blast was long lived and delivered snow to many regions of the country. While heavier snowfalls have been recorded before in some regions, this is undoubtedly the most widespread and prolonged event since 1939 - the subject of a blog by Erick Brenstrum.