The Northland flooding event, July 8th to 12th 2014
The average July monthly rainfall total at Kaikohe, Northland, is around 180mm. In just one week in July 2014 the rainfall recorded there totalled 477mm, and that wasn’t even the wettest part of the region.
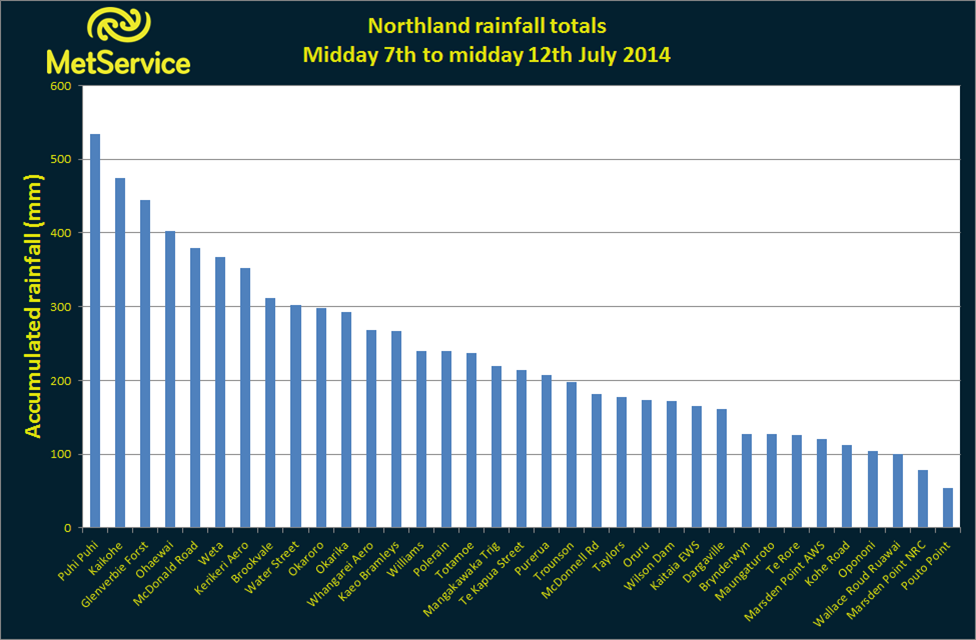 Accumulated rainfall at rain gauges in Northland from the 7th July to the 12th July 2014. Data coutesy of Northland Regional Council.
Between the 8th July and the 12th July 2014 the far north of New Zealand suffered beneath a persistent barrage of rain and strong winds, leading to widespread flooding and wind damage. The strongest winds started during the 8th of the month with gusts of almost 150km/h recorded at the weather station at Tutukaka Harbour. The average wind speeds recorded at Tutukaka harbour exceeded gale force for almost every hour for three days with gusts even stronger.
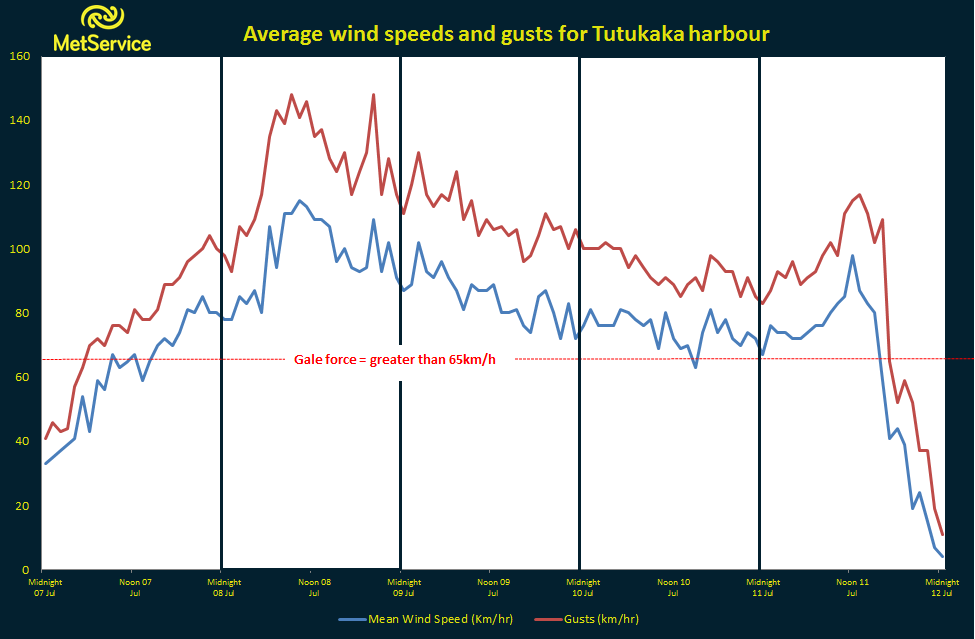 Tutukaka, on the east coast of Northland, experienced gale force wind speeds or higher for almost three whole days.
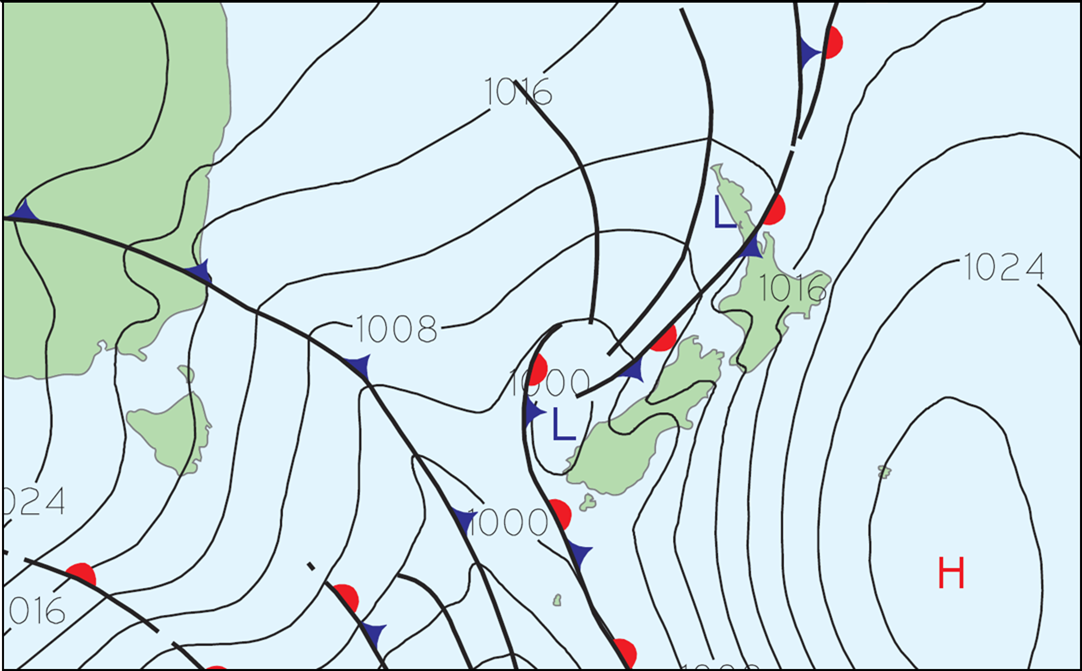
Tuesday 8th July 2014
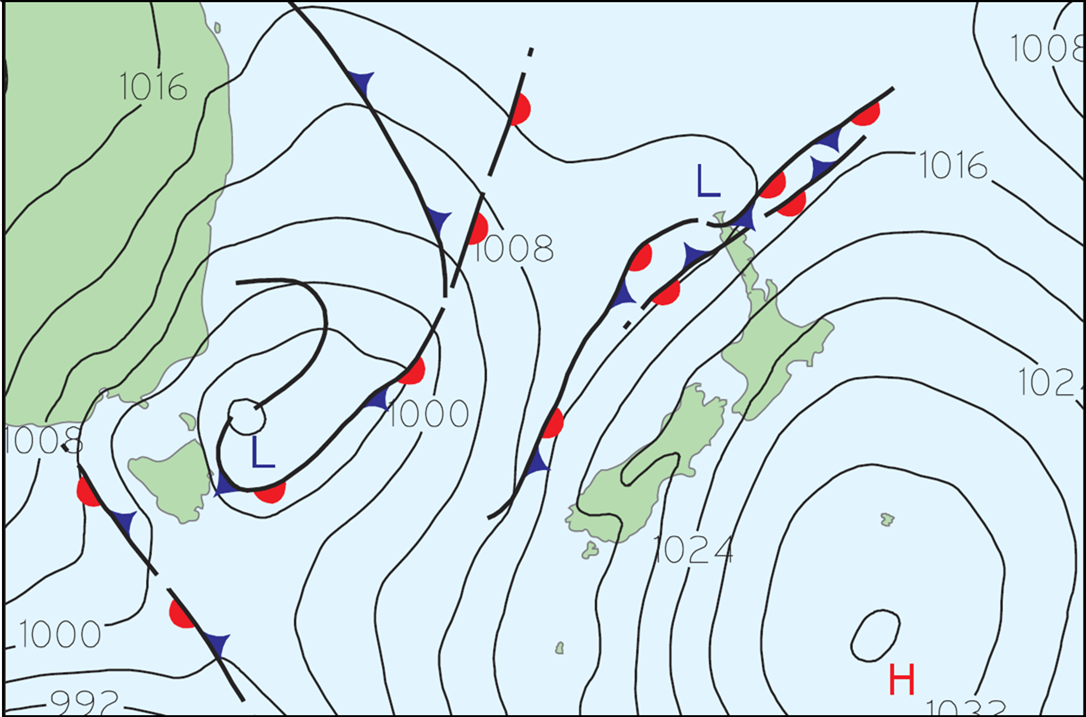
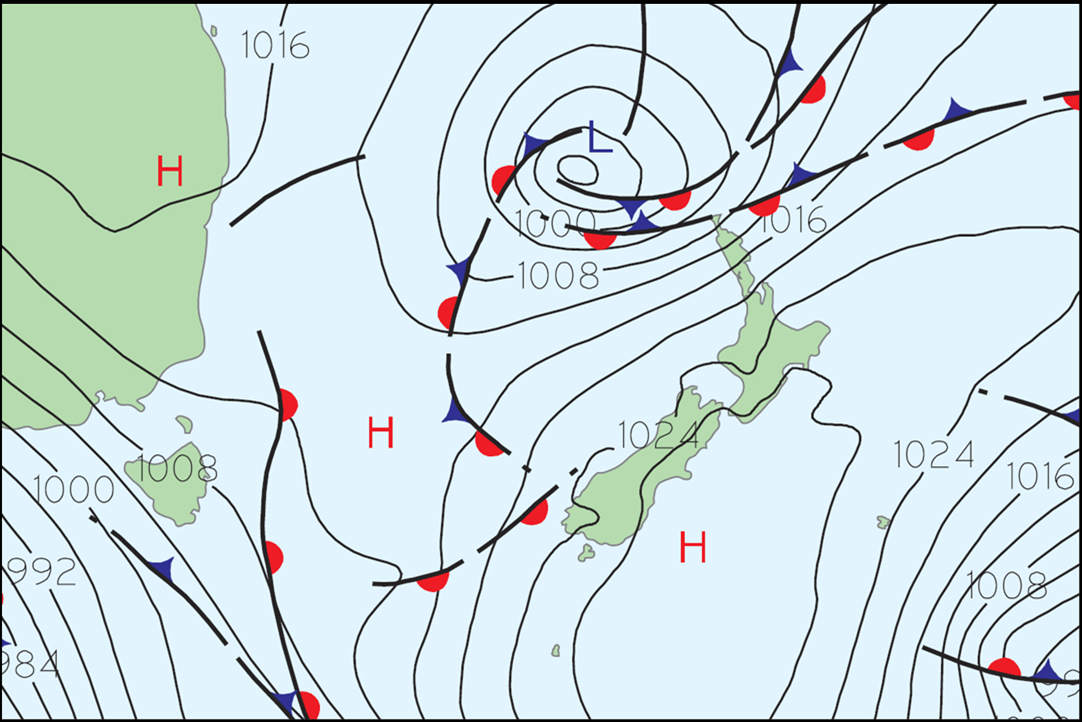 Midday analysis chart for 8th July 2014.
This analysis chart from midday on the 8th sets the scene nicely, not just for the Tuesday but also for the following few days. An area of low pressure sat to the northwest of the country while to the southeast of Aotearoa a broad area of high pressure remained centred off the east coast of the South Island. Looking out even further west another area of high pressure sits over the eastern coast of Australia.
The pressure differences across the world are what causes wind, with air moving from areas of high pressure (marked by a H) and areas of low pressure (marked by a L). Because of the way the earth spins, air doesn’t flow straight from the centre of the high to the centre of the low but is forced to turn as it moves leading to air flowing anticlockwise away from an area of high pressure and clockwise towards an area of low pressure.
The thin black lines on the pressure maps mark areas of equal pressure, called isobars. The spacing between the isobars can be used as an indication as to the wind speed, where the isobars are close together, often referred to as a tight pressure gradient; the winds are stronger than when the isobars are widely spaced. Looking at the pressure chart for midday on the 8th you can see a tight pressure gradient across Northland. Note that large area of high pressure to the southeast of New Zealand. Over the following analysis maps keep an eye on the position of the 1024hPa line.
Wednesday 9th July
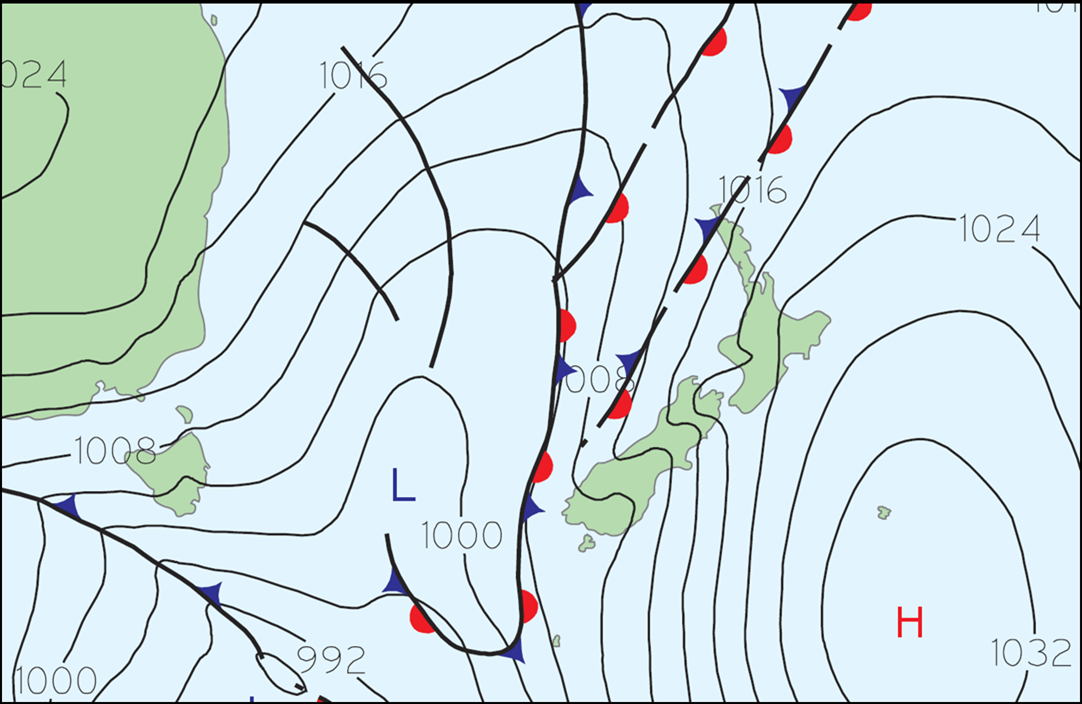
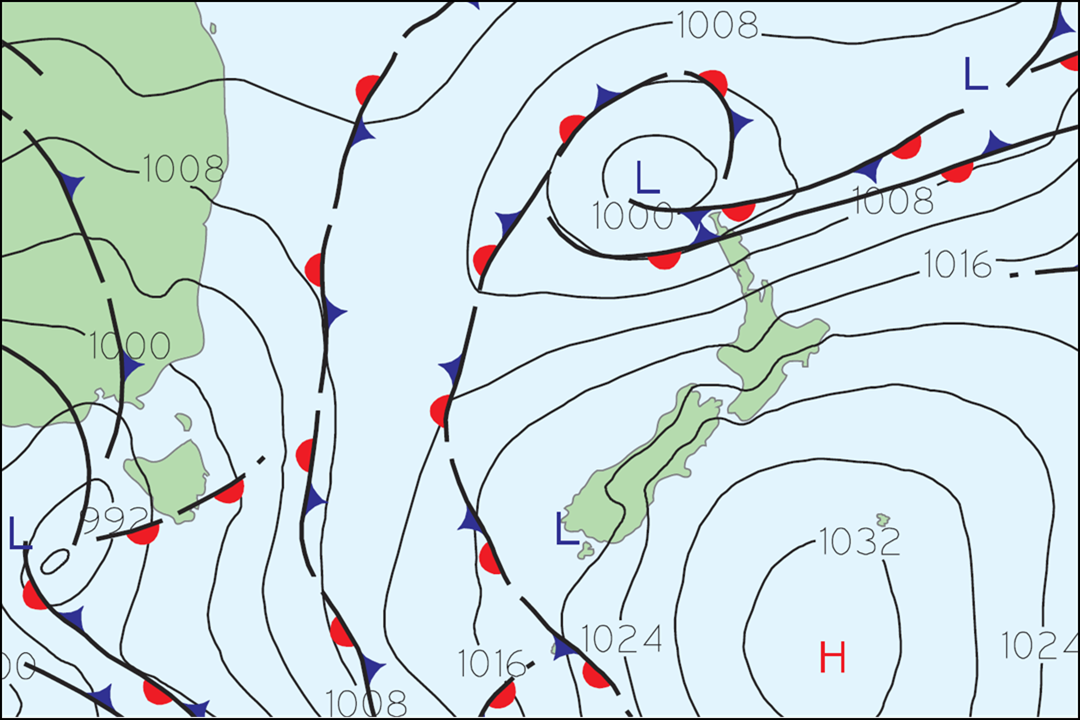 Midday analysis chart for 9th July 2014.
Looking 24 hours later at the analysis chart from midday 9th of July: What has changed? The Low pressure has moved a little closer to Northland. But note the area of high pressure to the southeast: The structure of the isobars is displaying symmetry and the central isobar has increased in value to 1032hPa. The high is intensifying and the analysis is displaying what we call in meteorology a “blocking pattern”. A blocking high can herald a long dry spell of settled weather, such as the block we had the summer before last.
In this situation the blocking high pressure is having the effect of delivering an extended settled spell to the east coast of both islands but it is also slowing the westward progression of that low pressure near Northland. This is effectively what a blocking high is defined as. The normal state of the atmosphere in the mid-latitudes (where New Zealand lies) is for westerly airflow carrying a succession of weather systems across New Zealand from west to east. Blocked flow occurs where the development of an anticyclone (a high) acts as a barrier to this westerly airflow, diverting it to the north or south. Without the blocking high, the low would probably have moved rather quickly across the northern half of New Zealand and off to the east. Instead, in its blocked position, all it can do is keep rotating cyclonically in an almost fixed position.
Another aspect of note is that the slow-moving low has travelled over warmer seas in the north to reach Northland. It has thus picked up a lot of moisture on its journey and moving over the relatively colder sea near northern New Zealand, it is becoming destabilised in the lowest layers of the atmosphere. This destabilisation is enough of a trigger to produce heavy falls of rain. The low is also pushing against the high pressure and the isobars are being squeezed together over an area that just happens to be Northland, thus the wind remains consistently strong.
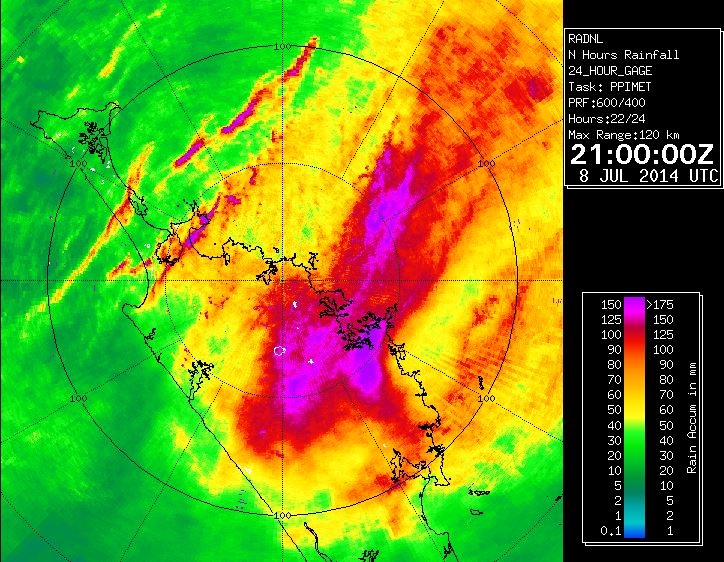 This is the 24 hour gauge corrected radar up to 9am on the 9th July. (Note that it says 21:00Z on the 8th of July – this is UTC time).
Examining the radar with the pink and red indicating the highest accumulations, more than125mm in 24 hours. Looking at the image shows that eastern areas are bearing the brunt of the rain. This fits with the cyclonic, clockwise circulation of the low pressure system, feeding the rain into eastern areas and exposing them to the highest winds. Kaikohe recorded its second highest 24 hour rainfall total in 30 years with 159mm of rain falling into the gauge.
Thursday 10th July 2014
 Midday analysis chart for 10th July 2014.
Another 24 hours later and the blocking high has hardly budged and looks to have even broadened its reign over the oceanic area to the east of the country. The low pressure near Northland is weakening but remains firmly wedged in position. An area of low pressure near Tasmania is priming itself to cross the Tasman Sea. Let’s see if it can help Northland’s low in pushing this stubborn high further east.
Friday 11th July 2014
The analysis for Midday the 11th of July (below) shows just how quickly some of those areas of low pressure can move westward. Look at the progress that low pressure system that was near Tasmania 24 hours previously has made. The blocking high is still holding position, however, a selection of fronts out to the northwest of Northland indicates that there is still more heavy rain to come for the already flooded region.
 Midday analysis chart for 11th July 2014.
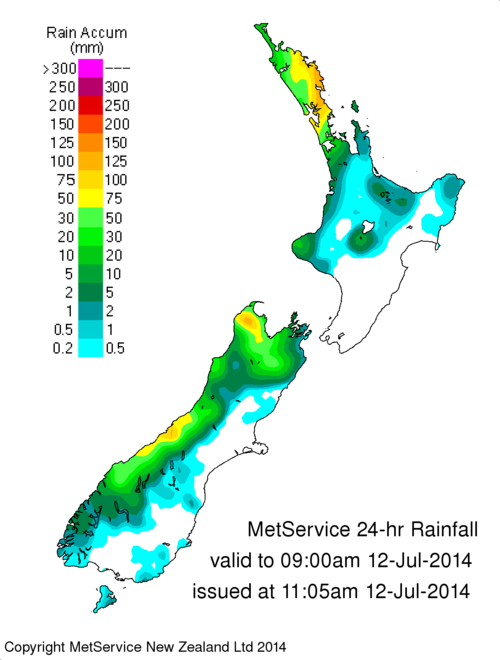 This map is showing the 24 hour rainfall totals from 9am the 11th of July to 9am on the 12th of July.
The frontal system moved through in the early hours of the 12th of July delivering its final blow to the area. Well over 100mm fell at a number of stations during the 24 hour period with Kaikohe experiencing its 3rd highest accumulation for a 1-day period on record with 146.2mm. This second burst of heavy rain fell on top of already sodden soil.
Saturday 12th July 2014
 Midday analysis chart for 12th July 2014.
The last midday analysis on the 12th of July shows the front down over Auckland. Note the spacing of the isobars around Northland have widened, indicating a slackening in the wind. The blocking high has finally shifted westwards. As the front moved across the Bay of Plenty it produced some heavy falls of rain and gusty winds, but with rainfall totals of around 20 to 30mm the region escaped relatively unscathed compared to the Far North.
The persistent nature of this severe weather event exacerbated the impacts of the weather with days of heavy rain and strong winds leaving their mark across large parts of Northland.
Before and during severe weather events the MetService severe weather forecasters work around the clock providing the latest forecasts to regional councils, civil defence and to the public. You can always find the most recent weather warnings here on MetService.com and you can subscribe to have them sent straight to your inbox as well.