The story of summer 2012/13 was rain, or rather the lack of it. Drought was declared for the North of the country on the 27th February, shortly followed by the rest of the North Island and parts of the South Island. The prolonged dry spell was due to presence of large lingering areas of high pressure that dominated the weather across New Zealand. These areas of high pressure acted as blocks, sitting over the country while areas of low pressure, and their associated rainfall, skirted either side of the country. There’s more about the nuts and bolts of this here.
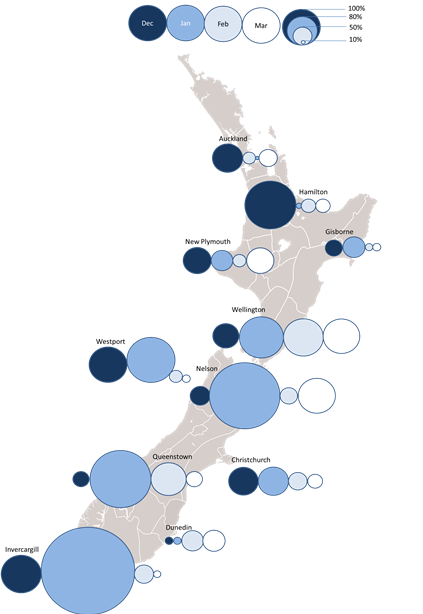 Figure 1: Rainfall December 2012 to March 2013 compared with normal.
Figure 1 shows a comparison of observed rainfall with average monthly precipitation, for a number of cities, between December 2012 and March 2013. While a few stations recorded above average rainfall during some of the summer months, the general trend for summer, including March, was for rainfall totals to be less than normal. For example, in January this year there was only 9.2mm of rainfall reported at Auckland Airport; the January average is 71mm. Between January and March only 79mm of rainfall was reported at Hamilton, which is just a little above the average for January alone. When we did have rainfall it mainly came along as bands pushing across the country from west to east. Because of this, the likes of Dunedin, Christchurch and Gisborne on the east coast received very little. Looking at the averages alone can sometimes be misleading – take, for example, the rainfall in Wellington.
Looking back at Figure 1 we can see that rainfall totals in January, February and March all appear to be around average for the time of the year (75mm in January (116% of average), 54mm in February (105%) and 70mm in March (97%)). However, when looking at the distribution of the rain through each month (see Figure 2, below) it is clear that much of each month’s rain fell in a day or two. There was a 32 day period between 13 February and 17 March where no rainfall was recorded at all.
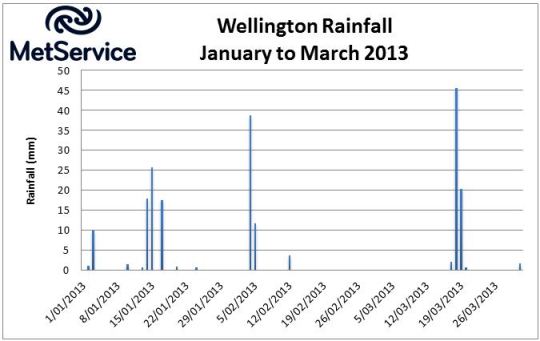 Figure 2: Daily rainfall over Wellington, January to March 2013.
The rain that arrived in the Capital on 17 March was associated with the remnants of Tropical Cyclone Sandra. Sandra had tracked southwards from the Coral Sea before weakening over the cooler waters of the Tasman. Although a much weaker feature by the time it arrived over New Zealand, it was enough to bring some heavy falls of rain to the west coast of the South Island and the central parts of the country. These three images show the rainfall distribution over the country during the period.
 Figure 3: Rainfall distribution March 16th to 18th 2013
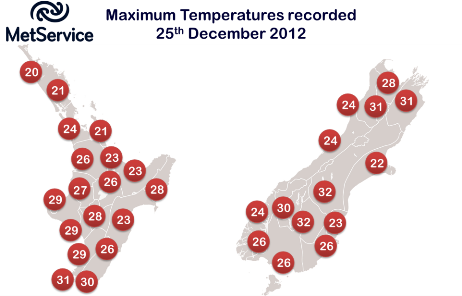
As well as being one of the driest summers on record, the long periods of cloud-free sky meant it was one of the sunniest. New Plymouth recorded 928hours of sunshine in the first three months of the year, significantly more than the 686hrs expected in an average year. (Data from NIWA). The sunny, dry conditions went hand-in-hand with some very warm temperatures. The top temperature recorded over the period was 34° C at Gisborne in March but in many spots temperatures exceeded 30° C on several days, and temperatures continued to reach into the high twenties right to the end of March. Invercargill reported a high of 27° C on the 31st of the month, 10 degrees above its March average. 25 December 2012 was also one for the record books with many places recording their warmest Christmas Day. The highest temperature recorded, 33° C was at Roxburgh. The image below shows a summary of the temperatures on Christmas Day.