Part of my job as a teacher of meteorology is to go to NZ universities looking for future meteorologists. It breaks my heart when, sometimes I meet a person with a genuine passion for the weather who would love to work for us as a meteorologist, but just can't cope with the required maths. Unfortunately for them, professional meteorologists need to have some university maths under their belts. And this requirement isn't just a local thing - it also comes from the World Meteorological Organisation of which we are a member nation.
Why is maths important in meteorology? Let me give a small example to illustrate, related to the thread of my previous blog posts, wind...
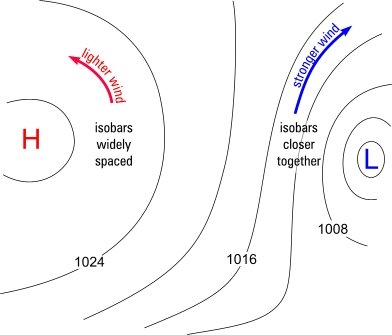
On weather maps we see isobars which are the lines going around each anticyclone (area of high air pressure "H") and depression (area of low air pressure "L"). Have you ever noticed that the isobars seem to spread out more in the anticyclones than in the depressions?
 How isobar spacing varies around anticyclones and depressions
To check out this effect, take a look at the real-life example below (covering a large part of the southwest Pacific - I have undisplayed the fronts), or have a look at a few current weather maps to see for yourself.
Mean Sea Level analysis, midday 4 July 2006
This spreading out of isobars in anticyclones is a fairly general result, and the reason comes down to the solution of a quadratic equation. If you did maths at high school you might remember these. I learnt about them in the fifth and sixth forms (now called Year 11 and Year 12). These equations look something like this: ax² + bx + c = 0, where a, b and c are given to you and you then have to work out what "x" is. You can find out lots more about them on the internet, e.g. Wikipedia, or just ask your kids!
When our trainee meteorologists study weather, they learn all about wind, isobars and air pressure, as well as the effect of the Earth's rotation. It turns out that there is a strong connection between these factors, and it is described by a quadratic equation (I won't write the equation here, but you can ask me for it through the comments section below if you're interested).
The solution, x, of this particular quadratic equation holds the key to the answer, because x represents the wind speed. In this case x behaves differently depending on whether you are in an anticyclone or a depression. For anticyclones there's a limit to how close the isobars can be and therefore a limit to the wind speed, depending on how close to the centre of the anticyclone you get (there is a small latitude effect too). However, for depressions there's no limit to the closeness of the isobars, provided the atmospheric forces are big enough to drive the air pressure into that configuration.
I think it's an amazing and powerful result, and it all comes down to school-level maths! This really is just the tip of the iceberg as far as maths and meteorology are concerned - you could spend a lifetime studying solely the meteorological applications of mathematics.
--------------
Postscript:
The quadratic equation has been requested as in the Feb 2011 comment below. The equation is:

