This blog post is the first in a three-part series discussing verification of MetService forecasts. Here, we present the method used for verifying rainfall in city forecasts, along with some examples.
Verification Scheme
Four times daily (around 11:15am, 4:15pm, 10:50pm and 3:45am) MetService issues city forecasts for more than 40 locations. Currently, for 32 of these (and soon for most of the remainder), the forecasts of tomorrow’s precipitation from today’s late morning issue are verified against observations from a nearby automatic weather station.
Counts of precipitation forecasts and corresponding observations are made using a categorical forecast verification system. The principle is described in the contingency table below. Over a given period (typically, a month), for each location, the number of times an event was
- A: Forecast and observed
- B: Forecast and not observed
- C: Not forecast but observed
… are recorded.

From these, indications of accuracy are readily obtained:
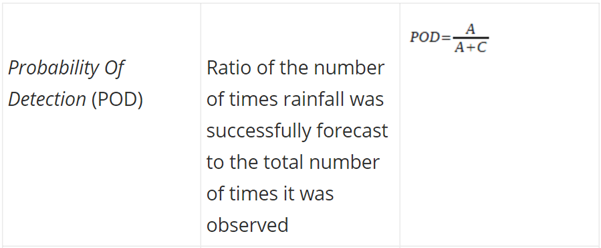
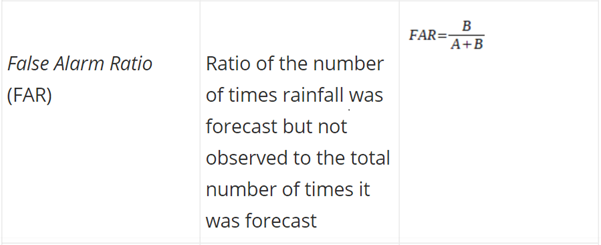
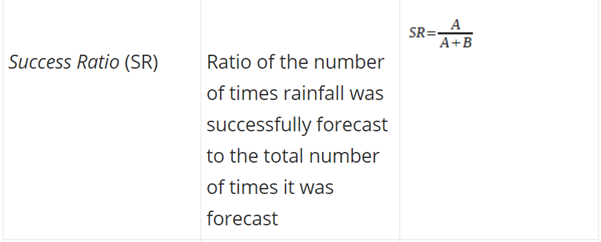
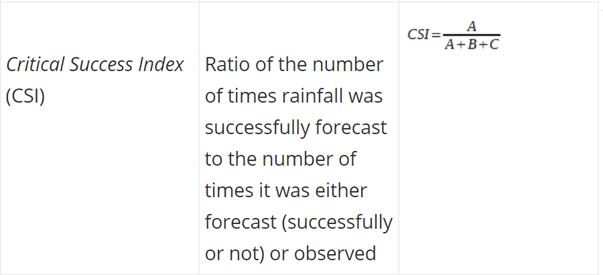
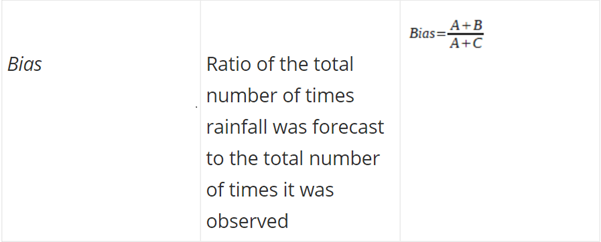 For good forecasts, POD, SR, Bias and CSI approach a value of 1.
In the verification scheme:
- “Tomorrow” is the 24-hour period between midnight tonight and midnight tomorrow
- The forecast is considered to be of preciprecipitation when the accompanying icon (as it appears, for example, in the city forecast for Auckland) is any one of “Rain”, “Showers”, “Hail”, “Thunder”, “Drizzle”, “Snow”, or “Few Showers”
- Precipitation is considered to have fallen if the automatic weather station records any precipitation amount greater than zero.
The scheme operates automatically – that is, there is no input by MetService staff.
Some Results
POD, SR, Bias and CSI can be geometrically represented in a single diagram, and therefore simultaneously visualised.
The diagram below shows the accuracy of the forecasts issued late morning, for tomorrow, of precipitation, for the 32 cities verified, during September 2010.
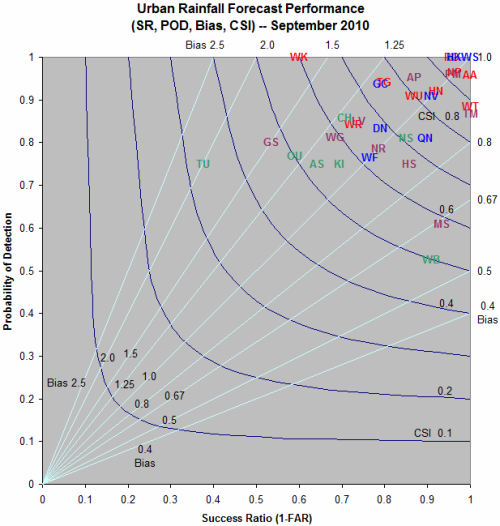
From the above diagram, for example:
-
The forecast for Auckland scores well, with Probability of Detection, Success Ratio and Bias all close to 1
-
The forecast for Timaru scores not as well: Probability of Detection around 0.75 is compromised by a Success Ratio just under 0.4 and a Bias of 2. In other words, during September 2010, the precipitation icon accompanying the late morning issue of the city forecast for Timaru for tomorrow, was too often one of “Rain”, “Showers”, “Hail”, “Thunder”, “Drizzle”, “Snow”, or “Few Showers”.
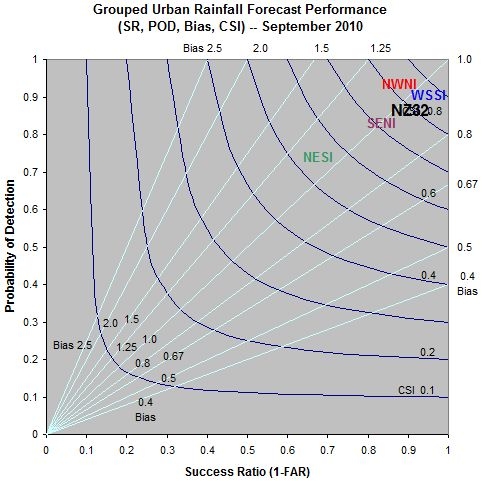
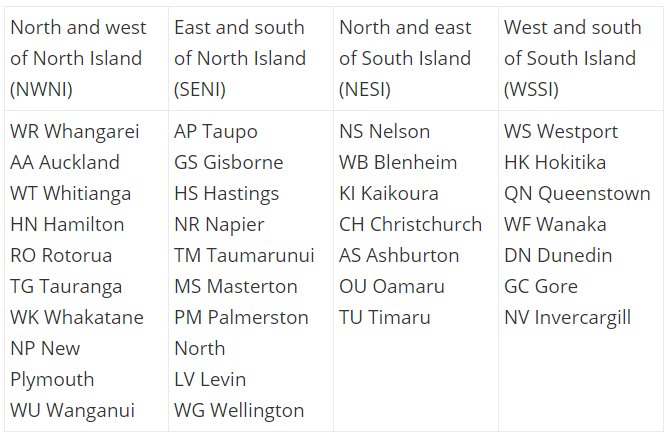
It’s also useful to see performance when the cities are grouped into the geographical areas described in the key above and overall. The diagram below shows the accuracy of the forecasts issued late morning, for tomorrow, of precipitation, for the 32 cities verified, during September 2010.
In this particular case, forecasts for the group of cities comprising the north and east of South Island (“NESI”) didn’t verify as well as for other places, with a Probability of Detection of about 0.75 and a False Alarm Ratio of about 0.3.
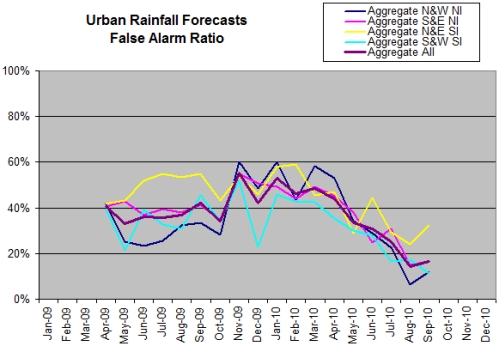
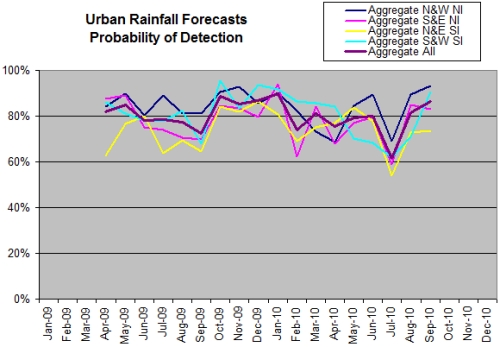
Further, it’s interesting to look at results dating from the implementation of this particular scheme in March 2009 through to 28 October 2010. Probability of Detection hovers at around 0.8 ± 0.15 (80% ± 15% in the graph immediately below). The False Alarm Ratio has shown a steady decline – in other words, predictions of rainfall in the city forecasts have improved in accuracy over the last year.
Performance Target
MetService's performance target for the forecast of precipitation in city forecasts is a combined POD greater than 0.77 for the 2010/11 financial year, increasing to 0.80 for the 2011/12 financial year.
Limitations
Even across small distances, there can be significant variations in rainfall during the course of a day. Thus, the observation point used to verify the forecast for a given place may or may not fairly represent the rainfall there – or may be a good indication in some weather situations but not in others. MetService observation sites are commonly at airports, which in general are at least some distance from the city or town they serve.
References
Finally, there is much literature about forecast verification. If you’d like to know more about it, try these:
Doswell Charles A., 2004: Weather forecasting by humans—Heuristics and decision making. Weather and Forecasting, 19, 1115–1126.
Doswell, Charles A., Robert Davies-Jones, David L. Keller, 1990: On Summary Measures of Skill in Rare Event Forecasting Based on Contingency Tables. Weather and Forecasting, 5, 576–585.
Hammond K. R., 1996: Human Judgment and Social Policy. Oxford University Press, 436 pp.
Roebber, Paul J., 2009: Visualizing Multiple Measures of Forecast Quality. Weather and Forecasting, 24, 601–608.
Stephenson, David B., 2000: Use of the “odds ratio” for diagnosing forecast skill. Weather and Forecasting, 15, 221–232.
