February 2010.
As the cicada season moves out and the mushroom season moves in, people have been commenting on the high humidity we had in February. This is no great surprise: the sea-surface temperature of the seas around New Zealand reach their annual peak in late February/early March, and the sea is the source for most of the water vapour in our air

When relative humidity (RH) is high, human hair absorbs moisture from the air and creeps or expands. Curly air frizzes and straight hair goes limp. From dry to saturated, hair length can change by three percent. In 1783, Swiss physicist and geologist, Horace Bénédict de Saussure used this principle to build the first humidity meter or hygrometer. These instruments, measuring relative humidity, became very popular. They were often in the form of a Swiss or German weather house in which a lass dressed in light clothes would come out in dry weather, and a lad dressed in wet-weather clothes would come out in damp weather. Because hair responds to relative humidity, these hygrometers helped to popularise RH as the main measure of humidity.

Relative humidity measures how close the air is to being saturated with water vapour, where 100% means fully saturated. However, the word saturation here can be misleading. It is a misconception is say that air “holds” or dissolves water vapour or that saturation is reached when the air can “hold” no more water vapour. There is always plenty of space between the air molecules for more water vapour molecules, and the saturation point, in fact, refers to a sustainable equilibrium.
Think in terms of energy. Temperature measures the kinetic energy of a material, or how fast its molecules are vibrating. In a pool of liquid water any molecules that are vibrating fast enough (as determined by the water temperature) will break free or evaporate and become water vapour, taking with them that extra kinetic energy -- so when sweat evaporates from skin, or saliva evaporates from a panting dog, it helps cool things down.
Here’s an experiment to show evaporative cooling:
-
Lick the back of your hand.
-
Blow gently across your hand. You should already feel a cooling sensation.
-
Now, use a towel to dry that hand and then use the opposite hand to feel the temperature of the skin on the dried hand. It should feel cooler to the touch!
Water vapour molecules that are moving slow enough (as determined by air temperature) will plunge back into water liquid, transferring energy to the molecules near where they hit and joining the liquid --- this is called condensation, and it’s a process that helps warm solids and liquids. Here’s an experiment to show condensation and its warming impact:
-
Breathe onto a pair of spectacles
-
The moisture in your breath will raise the RH of the air touching the glass to 100%, and the glass will fog up with water droplets, and warm a bit
-
Leave the spectacles alone for a while and the fog will evaporate, and the spectacles will cool a bit
When the air is “saturated” and RH is 100%, the rate of evaporation equals the rate of condensation, so the amount of water vapour in the air maintains equilibrium. This amount varies exponentially with the temperature.
“Muggy weather” is a term we use for a hot day when the humidity in the air becomes uncomfortable. On a hot day we sweat and thus keep our cool by evaporative cooling, but if the amount of humidity is high enough to disrupt this cooling then we feel hot and sticky, tired out. Cold air (as at dawn in winter) can have 100% RH and be foggy but since it isn’t warm enough to raise a sweat it will not feel muggy at all. So RH is not a measure of mugginess.

Dew point is the temperature you need to cool grass, or a glass, down to get dew or beads of moisture from the air. It is the temperature at which condensation occurs. It is a good measure of the amount of water vapour in the air and thus a good measure of “mugginess”.
Steve Horstmeyer of WKRC TV (1) has compiled the following table linking dew point to human perception of humidity:
Dew Point Perception
Less than -30ºC prolonged exposure will crack the skin
Less than 10ºC A bit dry for some
10-12ºC very comfortable
13-16ºC comfortable
16-18ºC OK for most, but all perceive humidity
18-21ºC somewhat uncomfortable for most people
21-24ºC very humid, uncomfortable
24-26ºC extremely uncomfortable, oppressive
Higher than 26ºC severely high. Highest measured has been 35C
Dew point depends on the region that the air reaching us comes from, and thus mainly changes only when the wind changes.
The following graphs of temperature, relative humidity, and dew point during February 2010 around the country show what made late summer so frizzy. It was a month when anticyclones lingered around southern Tasman Sea and central New Zealand, causing sunny warmer and drier than normal conditions. Between these high-pressure systems some passing troughs brought brief periods of rain, most notably the active front over Southern Alps on 13 February which caused the abandonment of the mountain run and kayak leg in this year’s Coast to Coast.
 Kerikeri, February 2010: Relative humidity on top, air temperature and dew point (ºC) below, with daily time stamps at 1pm NZDT (0000UTC).
The above trace is taken at Kerikeri and shows the warmest day to be 29ºC on 14 February. After that there was an extended period of northerly winds which raised the dew point to 20ºC. A southerly change on Friday 19 February helped to drop the humidity for a few days and then a further period of northerly winds raised it back to 20ºC on 24 and 25 February. Note the “flat-lining” of the RH trace at 100% on 24 February.
 Auckland, February 2010: Relative humidity on top, air temperature and dew point (ºC) below, with daily time stamps at 1pm NZDT (0000UTC).
In Auckland the trace is similar to that at Kerikeri, but the warmest days were only near 27ºC, and there was nearly a week of “twenty degree nights” and dew points above 18 ºC from 14 to 19 February and again on 25 February.
 Wellington, February 2010: Relative humidity on top, air temperature and dew point (ºC) below, with daily time stamps at 1pm NZDT (0000UTC).
In Wellington, February’s humidity was not as extreme as in Auckland or Northland. The warmest day was 27ºC on 6 February, and the warmest nights were 18ºC on 13 and 24 February.
 Christchurch, February 2010, Relative humidity on top, air temperature and dew point (ºC) below, with daily time stamps at 1pm NZDT (0000UTC).
In Christchurch, the relative humidity was regularly “flat-lining” at 100% in the last half of the month. On 23 February the wind came from the northwest, the temperature shot up to nearly 31ºC, and the dew point dropped to around 3ºC, producing a very low RH of 17 per cent. Dew point readings from selected stations are given in the coded observations page on metservice.com (in the 4 group: a number such as 40117 means the dew point is 11.7ºC). Relative humidity readings are shown on our National page (see below). MetService’s “feels like” temperature applies to people in the shade and takes into account wind chill when the air temperature is 10ºC, or, when it is above 14ºC, calculates the apparent temperature that accounts for any high humidity, as seen below. For air temperatures between 10ºand 14ºC there is a roll over from wind chill to apparent temperature.
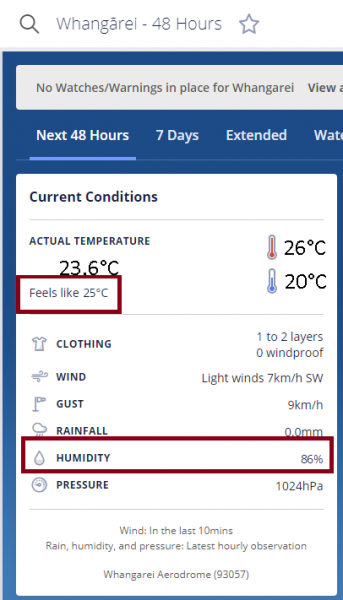
Example of humidity and apparent "feels like" readings at metservice.com
References
-
Horstmeyer, Steve (2006-08-15). "Relative Humidity....Relative to What? The Dew Point Temperature...a better approach". Steve Horstmeyer, Meteorologist, WKRC TV, Cincinnati, Ohio, USA.