The Japan Meteorological Agency launched a geostationary weather satellite called Himawari-8 in October 2014. “Himawari” means sunflower, and the name has been given to a series of satellites that we can look forward to in coming years. “Geostationary” means the satellite rotates “in sync” with the Earth, always above the same point over the equator.
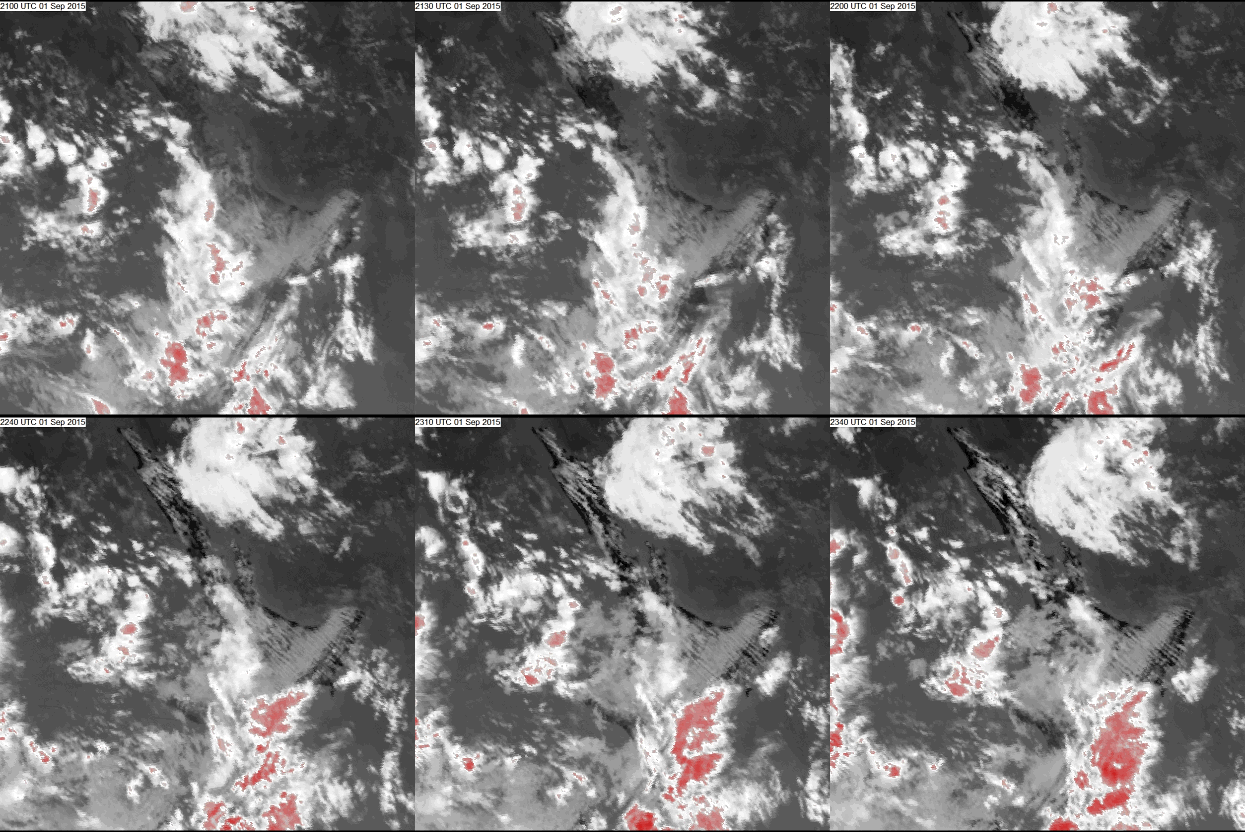
We, in New Zealand, receive data from this satellite. One of the important advances of the new sensors on board the satellite will be the capability to produce images for operational meteorologists every 10 minutes, compared with the previous standard hourly imagery. This frequency is close to that of our companion weather radar images. Here is an early example of the InfraRed (IR) satellite loop on the morning of Wednesday 2nd September.
 InfraRed satellite animation, courtesy of JMA.
The time-stamp in the top-left is in "UTC", currently 12 hours behind NZ time, so the loop:
-
starts at 2100 UTC = 9:00am on Wednesday 2 September, and
-
finishes at 2340 UTC = 11:40am on the same morning.
The InfraRed imagery in this animation is similar to familiar satellite images on TV, metservice.com and newspapers. It shows high cold clouds as red or white, and warm low clouds, the Earth’s surface and the sea as dark grey or black (see the description of the InfraRed “enhancement” in this earlier post). The horizontal resolution of the images is 2 km, so it’s possible to discern more detail than from previous geostationary satellite sensors. Here’s an explanation of what we can see:
-
The cloud is moving from the northwest towards the southeast. The speckled texture of the cloud over western parts of North Island and the Tasman Sea is typical of convective showery conditions. These clouds are puffy cumulus clouds, towering cumulus clouds or very big cumulonimbus clouds (with cold tops).
-
Skies are clear over parts of North Island where the colouring is black, and the shading of these areas darkens as the morning progresses and the land heats up.
-
There is evidence of banding in the grey clouds over the east of North Island; this is particularly noticeable over Gisborne. These are lenticular clouds in the lee of the mountain ranges.
-
There are different bands aligned with the flow over Northland and Bay of Plenty – these are cloud streets, similar to those structures discussed in an earlier post.
Now let’s have a look at the corresponding satellite images in Visible wavelengths of light. These are at 0.5 km resolution.
 Satellite animation in Visible light, same period as previous, courtesy of JMA.
Here all cloud shows as white or a shade of grey, and what we see is sunlight reflected off clouds and the Earth’s surface. There is much more detail than in the IR images.
-
The coastlines become clearer later in the morning as the sun rises higher in the sky and the land brightens up.
-
The cloud streets and lee-wave clouds are very clear. If you have eagle eyes, you can just make out a single cloud street generated by White Island (off Bay of Plenty) towards the end of the sequence. Over Gisborne, towards the end of the animation, the two processes of lee-waves and cloud streets seem to be super-imposing.
-
The lumpy shower clouds tend to have wispy edges, and these are generated by high cirrus clouds (composed of ice crystals) that spread out from the cumulonimbus clouds.
-
There are also some interesting cloud shapes around Mount Taranaki as the flow is disrupted as it flows over and around the mountain.