The term RADAR stands for RAdio Detection And Ranging and was coined in 1940 by the United States Signal Corps, although it was German physicist Heinrich Hertz who showed that radio waves could be reflected from solid objects, in around 1886. During World War II, radar technology developed rapidly and has since become an essential tool in meteorology, as well as in other areas such as air traffic control.
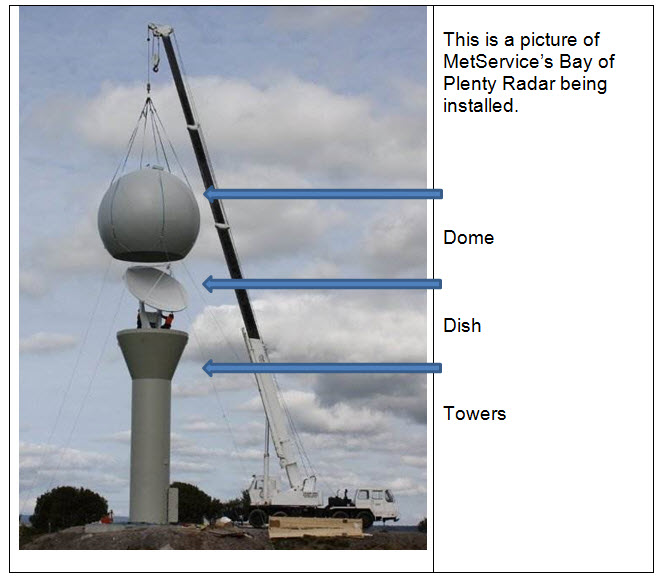 MetService’s Bay of Plenty Radar being installed.
Meteorological radar works using the backscattering of microwave energy from water or ice particles. A relationship between the particles' characteristics and the returned energy has been developed, so that the returned energy gives us information about the particles being sampled, for example rain or hail.
The radar sends out pulses of microwave energy and then listens for returning signals of energy reflected off a target, such as rain droplets. Microwave energy travels at the speed of light. Using very accurate measurement of the time when the pulse is sent and the reflected energy received, the distance to the target is determined. We also know in what direction the radar dish is pointed, so now we know the direction and distance to the location of the rain or hail. Radars rotate 360 degrees as they send out pulses, to get information in all directions.
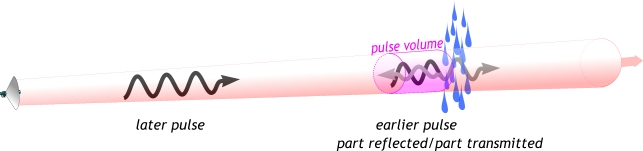 Image: Chris Webster, MetService.
Radar pulses in a beam. Note: this diagram is not to scale; the space between successive pulses is thousands of times larger than the pulses themselves.
The radar antennas are parabolic dishes about 5m in diameter (this varies with manufacturer) which focus the beam to give us a beam width of 1 degree. The antenna elevation changes during the 7.5 minute scan cycle - it is stepped up between rotational scans to allow us to build up a volumetric picture of the atmosphere.
MetService has 10 radars operating across New Zealand and you can see where each of these is located on the image below.
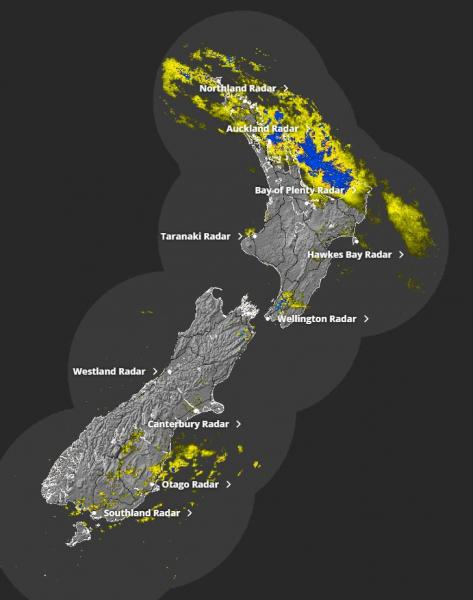 Radar image from September 27th 2024 3.35pm
The latest radar images can be found at: http://bit.ly/NZRainRadar
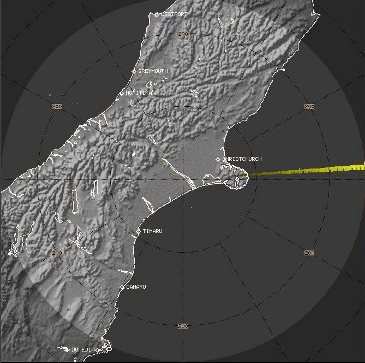
Each of the radars completes a series of scans every seven and a half minutes and the data is sent to MetService, where further processing takes place to produce a composite image of the precipitation over the country. This image shows the coverage of MetService radars over New Zealand. Each of the radars is located at the center of the circles. The smaller circles mark the area/range in which the radar is very accurate and the larger area outside of these is useful as a heads-up.
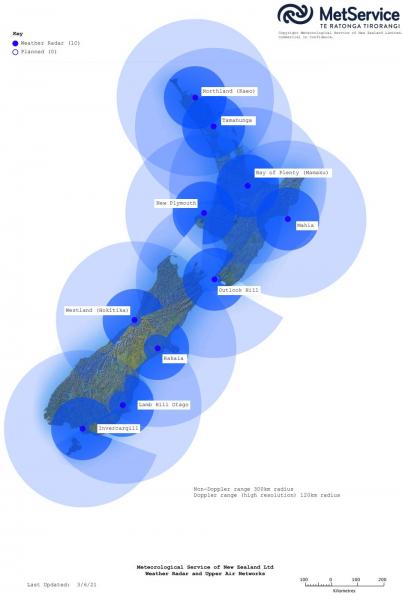
Some smaller circles are not complete; this is because the radar beam (the pulse of microwave energy) is blocked by topography in some directions. This is why the Radar image during the Dunedin rainfall event on June 3rd & 4th 2015 didn’t show the full extent of the rain. When the beam leaves the radar, it is affected by the curvature of the earth which curves away from the direct line of the beam.
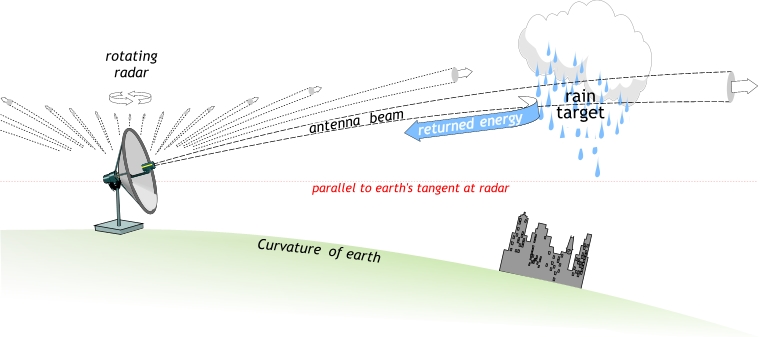 Image: Chris Webster, MetService
The further away you are from the radar, the higher the beam is above the surface of the earth. So if the rain is falling out of low cloud far away from the radar itself, it may not be detected by the radar as it is literally 'under the radar'. Large objects such as mountains can block radar beams - this is called orographic screening. It is why we have located radars east and west of the divide and around the country, positioning them to get the best coverage. Unfortunately, the radar can also pick up interference from other sources leading to unusual shapes that can sometimes be seen on radar images.
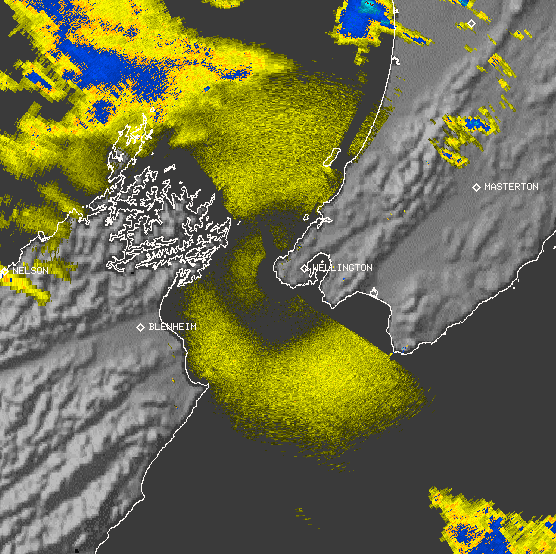
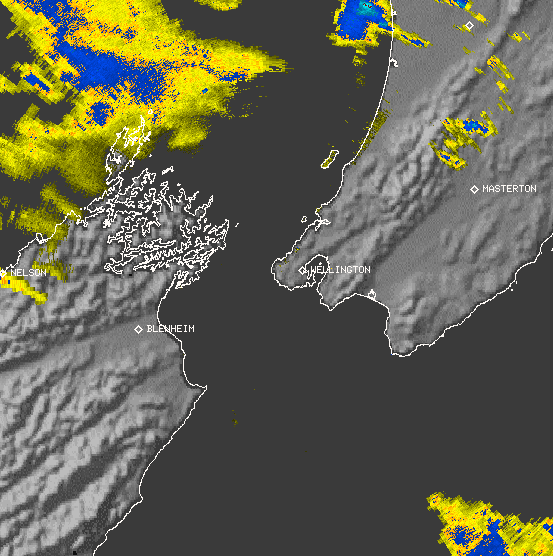
Two views of the Wellington weather radar. The left-hand radar image shows sea clutter which is caused by choppy seas in Cook Strait. The sea clutter has been removed from the right-hand image. Sometimes on a radar image it can look like a signal for showers, but our observation stations at the surface do not record any precipitation. This can be due to a type of precipitation called virga, which is when precipitation falls from cloud but evaporates before reaching the ground. Have you ever seen a bright line on the radar image in the morning or evening? It could be the sunrise or sunset.
Radar is used to track, diagnose and forecast the future position of rain, showers and thunderstorms. This includes tracking severe weather associated with thunderstorms (lightning, hail and even tornadoes). Radar cannot always detect drizzle, as the droplets may be forming to close to the surface to be seen by the radar.
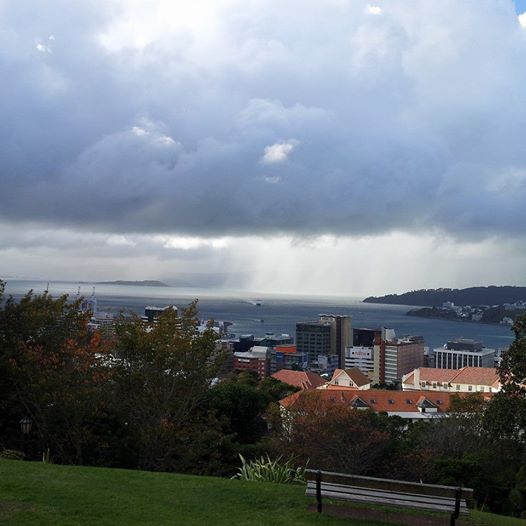
A shower over part of Wellington Harbour can be seen on the right-hand side of the photo, while Matiu/Somes Island on the left hand side remains dry. Photo taken from the Botanic Gardens by Lisa Murray, MetService.
The latest radar images for New Zealand can be found on our website at http://bit.ly/NZRainRadar . Or from the Home page, click on the Maps & Radars tab and you'll see Rain radar:
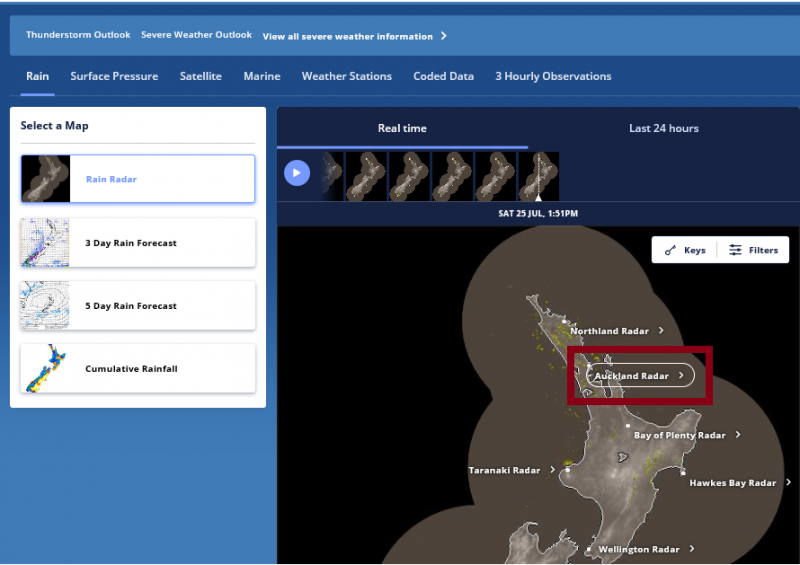
Regional radar images can be found by going to the forecast page for your area and clicking on the rain radar image on the right hand side of the page. For example http://metservice.com/towns-cities/auckland/auckland-central , then click on the 'Auckland rain radar' image which brings you to http://metservice.com/maps-radar/rain-radar/auckland