Climate Knowledge for Climate Action
Each year on 23rd March, National Weather Services around the globe celebrate World Meteorological Day. This marks the establishment of the World Meteorological Organization (WMO) on this day in 1950. WMO is the global co-ordinating agency for meteorological and hydrological activities, formed because weather simply doesn’t limit itself to national boundaries. World Meteorological Day is an occasion to commemorate the work that national meteorological and hydrological agencies undertake 24 hours a day, 365 days per year – work that produces weather forecasts and warnings to help keep our communities safe. The passage of Cyclones near the Pacific islands and past New Zealand are timely reminders of these efforts.
Collecting weather data ...
The routine collection of weather data is one part of MetService’s international responsibilities under the Global Observing System (GOS). Worldwide, weather agencies take observations of pressure, temperature, wind and rainfall around the clock. Data come from ships, buoys, weather balloons and land-based weather stations, and are transmitted via the WMO Global Telecommunication System (GTS). This is a world-wide stream of data used as input into global weather forecast models. The better we can “start off” (initialise) the global computer models as to the current state of the atmosphere, the better the future state will be predicted – and the more accurate the weather forecast will be for your place.
In New Zealand alone, hundreds of weather stations from Stewart Island to Cape Reinga tell us how wet, warm, or windy it is every hour, as well as measuring pressure and humidity. Weather balloons are released twice daily at several locations around the country. Recently, MetService has collaborated with the U.K. MetOffice to enable kiwis to share their local weather data on the ‘Your Weather’ section of metservice.com via the ‘Weather Observation Website’ (WOW) system.
... for climate knowledge, too
This year, the theme for World Meteorological Day is ‘climate knowledge for climate action.’ This is a timely focus. Globally, 2014 was the warmest year on record and fourteen of the fifteen hottest years have occurred this century. But how do we know this? That’s right – we looked back at historical weather data.
Think of climate as the sum of all the weather. If you smooth out all of the edges looking at things longer-term (from a climate perspective), it is possible to more clearly understand what is going on. Climate patterns such as the El Nino Southern Oscillation and the Southern Annular Mode are more ‘visible’ this way, including their effect on New Zealand wind, rain and temperature.
‘Reanalysis data’ is a very important tool for scientists trying to unlock the physical mechanisms behind our climate - trying to understand why we had a wet month, a warm year, or an active Cyclone season. Reanalysis datasets input historical weather data from around the globe into the same climate model, and extend it back over time. The relationships found in the past can help us forecast the future – this is the basis of seasonal climate predictions. For example, El Nino springs tend to be very cold in New Zealand, due to frequent southerly airstreams over the country. When we know an El Nino spring is coming, and in the absence of other major climate factors, the odds are that we’re in for an unusually cold spring.
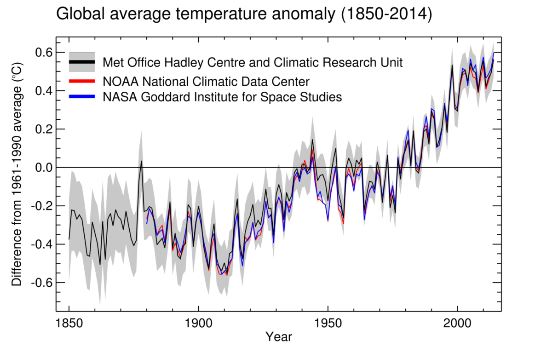 Global temperature data (departure from normal), based on three different reanalysis datasets. The data all tell the same story – a rapid increase in global average temperature since the 1960s.
There are many examples of when historical weather data helps put things into climatic context. For example, people have asked, “is Cyclone Pam the worst Tropical Cyclone to hit the South Pacific?”. The answer relies on good data being available. Since Cyclone Zoe (2002) and Cyclone Pam (2015) both reached an estimated minimum central pressure of 890hPa, it looks like a tie. And although satellites provide a relatively short record, their data can also help answer questions about Tropical Cyclone frequency. No increase in Tropical Cyclone numbers has been observed in the South Pacific over the last few decades since reliable satellite data have been available. 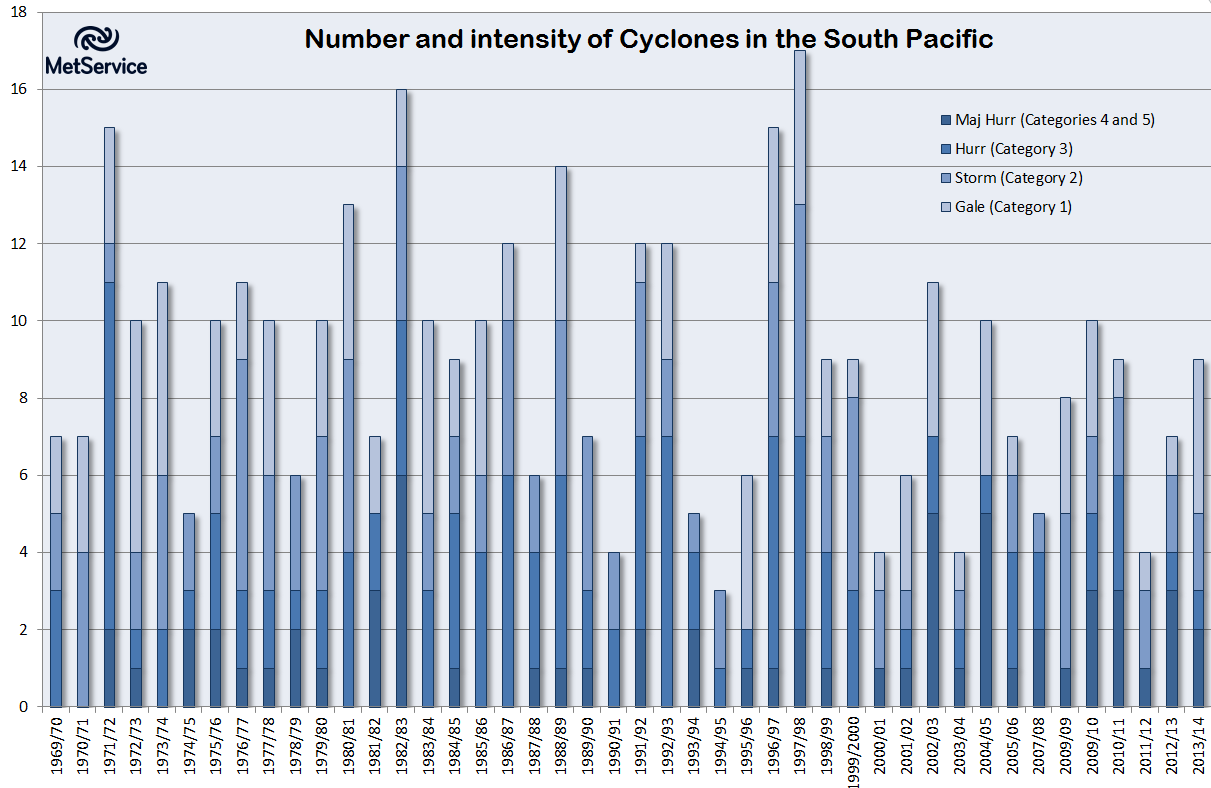
 Peter Lennox, MetService Chief Executive, is New Zealand's Permanent Representative with the United Nations World Meteorology Organization as @ 2015
MetService also contributes to international climate activities directly. MetService CEO Peter Lennox was New Zealand’s Permanent Representative to the World Meteorological Organization in 2015. In addition, MetService has supported several major climate initiatives in New Zealand.
MetService and NIWA have collaborated to achieve official Global Climate Observing System (GCOS) Reference Upper Air Network status for the NIWA atmospheric research station at Lauder in Central Otago.
This is only the fourth upper-air site to be certified in the world, and the first in the southern hemisphere. Well-calibrated atmospheric observations are crucial to documenting climate and climate change. The standard network of upper-air meteorological observations, and also weather satellites, provide good coverage – but high-quality observations are needed against which these standard observations can be calibrated. The pairing of Lauder observations and MetService’s Invercargill radiosonde data will achieve the necessary calibration. 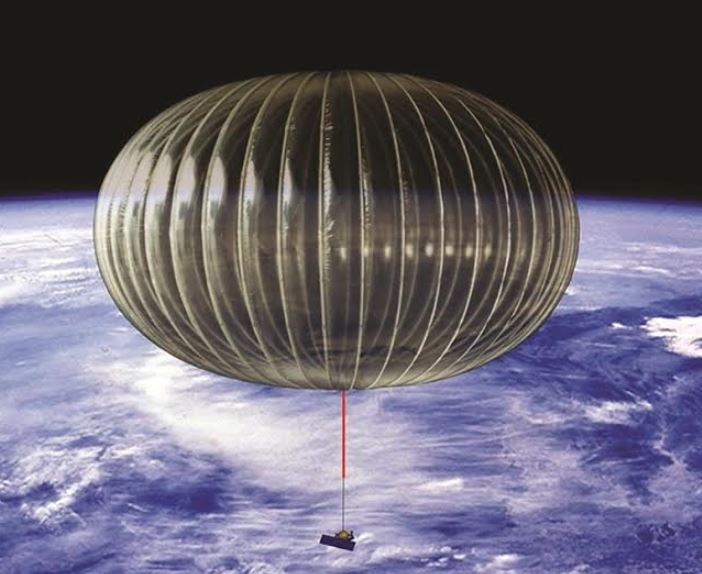 And NASA’s super pressure balloon is awaiting lift off at Wanaka, being delayed due to adverse winds associated with Cyclone Pam. Designed to drift eastwards at an altitude of 110,000 feet (‘near space’), NASA expects the super pressure balloon to circumnavigate across South America and then South Africa, on its potentially record-breaking flight. Depending on the stratospheric wind speeds, the balloon should circumnavigate the earth every one to three weeks. The flight goal is to exceed the current super-balloon flight record of 54 days, and to maintain a constant float altitude. If the balloon test is validated, this opens the door for relatively inexpensive atmospheric research.