Written By Jonathon Tunster, Meteorologist
On the night of 17th July 2009 and early on the 18th, New Zealand was affected by a fast-moving and rapidly deepening depression originating in the north Tasman Sea. Sustained southwesterly winds of more than 60 knots were recorded in Colville Channel as the low passed by. Severe Weather Warnings were issued for wind in Coromandel/Great Barrier Island and rain in the eastern North Island.
This post will have a look at some of the reasons that the low deepened so rapidly, and whether the computer models did a good job of predicting its path. We'll also see that weather is a lot more complicated than simply following what happens at the surface only.
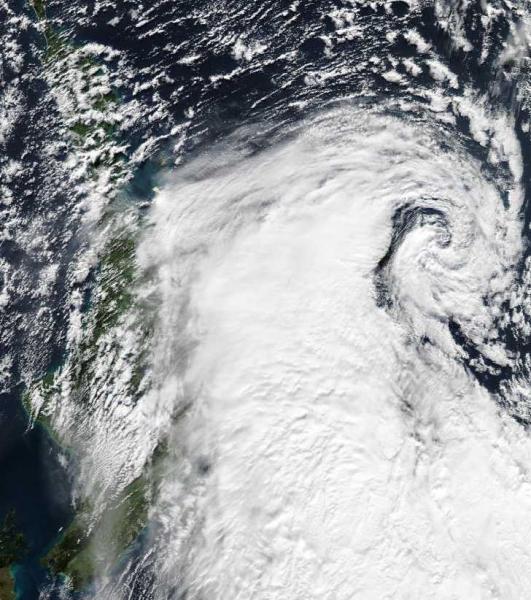
MODIS imagery of the low as it moved away from the country on Saturday 18th July
On Friday 17th July at 6PM, a low was analysed just west of Northland with a central pressure of about 997 hPa.
24 hours later the low lay a few hundred kilometres east of the North Island and had deepened to around 975 hPa. It continued deepening as it headed southeastwards - New Zealand was only affected by the first stages of the rapid development.
 Midday 17th July - a "slack low"
 Midnight 17th July - 12 hours later the low has quickly evolved
The rapid development of this low cannot be adequately explained by considering surface conditions only. Chris Webster here states "Perhaps we inadvertently reinforce a perception that our weather is 2-D by publishing lots of weather maps that are valid only at the Earth’s surface (e.g., see Weather Maps). Rarely do we show what’s happening higher up through the atmosphere or, more precisely, the troposphere —?the part of the atmosphere that contains our weather."
Our low was in fact strongly influenced by what was happening at the highest reaches of the troposphere - the regions where jet streams tend to be present.
Upper levels
ECMWF forecast for 3PM on the 17th. Green contours are surface isobars. Shaded regions are those of high upper level winds (black being the strongest).

This forecast chart is entirely computer generated, but shows why the low began organising itself and deepening from the Friday evening. The surface low pressure centre lies near the equator-ward entrance region of an upper level jet stream. This is a particularly favourable position for cyclogenesis (meaning development of a low). This is because it is an area of upper level divergence, which favours convergence at the surface and upward motion - both of which are conducive to developing depressions. The other favourable position is the pole-ward exit region. Where these coincide (the exit of one jet, and the entrance of another), and where a low lies downstream from a sharpening upper trough then a recipe exists for "explosive cyclogenesis":

Here are the comments made by senior forecasters regarding the development of this low:
"A sharpening upper trough over the Tasman Sea with double jet structure should provide strong upper level divergence for the low developing there." "Deepening caused by very strong divergence and vorticity associated with a broad very strong subtropical jet with winds reported 150-200 kt by aircraft"
......................................................................
The actual behaviour of the low
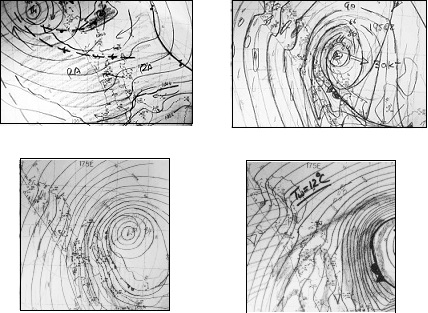
Analysis charts above, drawn every 1 hPa, show the actual track of the low as analysed by a senior meteorologist. Chart times are 6PM 17th (top left); 6AM 18th (top right); 9AM 18th (bottom left) and Noon 18th (bottom right). Contrast the 6AM analysis with these forecast model prognoses for that same time:

Surface pressure contours. UKMO Unified Model (red) and ECMWF IFS model (blue) output for 6AM 18th July. Model runtime was midnight 15th July
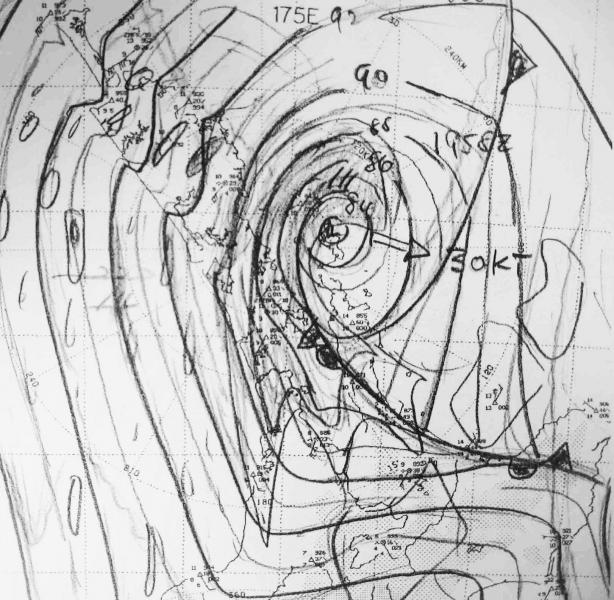
Surface analysis for 6AM on the 18th July
There was considerable disagreement between models as to the track and depth of this low, and, as suggested by the analysis, no single model got it quite right. Even though computer models are becoming ever more sophisticated, it's important not to slavishly follow their predictions. As we have seen with this fairly brief event, it's crucial - especially for high-impact weather events - to have professional meteorologists monitoring the situation and applying their judgement and conceptual knowledge of meteorology to the output of the models. This is something that is not likely to change in the future.