The MetService team produces both coastal and recreational marine forecasts. Part of these forecasts includes the state of the sea and the swell. But what is the difference?
Firstly, it is important to understand how a wave is described. Figure one shows the different characteristics of a wave.
 Figure 1: Wave characteristics
a - wave amplitude. The vertical distance from mean level to crest, measured in metres.
H - wave height. The vertical height from crest to trough, measured in metres. It is equal to twice the amplitude.
L - wave length. The horizontal distance from crest to crest, measured in metres.
T - wave period. For a moving wave, the duration of one cycle from one crest to the next crest, measured in seconds.
A wave in the ocean is a disturbance that travels through water, accompanied by a transfer of energy. When the wind blows across the ocean, it creates wind waves. Over time these build up and become larger, self-sustaining ocean waves that travel beyond the area of wind that created them. Wind waves are not self-sustaining and will die out when the wind stops.
‘Sea’ is a description of the wind waves raised by the wind in the immediate neighbourhood of the place of observation at the time of observation. ‘Swell’ is a description of the ocean waves that are not raised by the local wind.
Sea
What we call sea state is the effect that the local winds have on sea conditions – this is independent of travelling swell waves generated by winds outside of the local area. Sea state is related to the Beaufort scale which describes the state of the sea. The Beaufort wind force scale is an empirical measure that relates wind speed to observed conditions at sea. It was originally devised by an Irish Royal Navy officer, Francis Beaufort, in the early 19th century. In that time, naval officers made regular weather observations however without a standard scale, they were very subjective. The Beaufort scale assisted in standardizing these observations. The scale has been adjusted and added to over the past 200 years, and while some countries use forces up to seventeen, the World Meteorological Organization recognises thirteen classes, from zero to twelve. Part of the modern Beaufort Scale is shown in figure two.
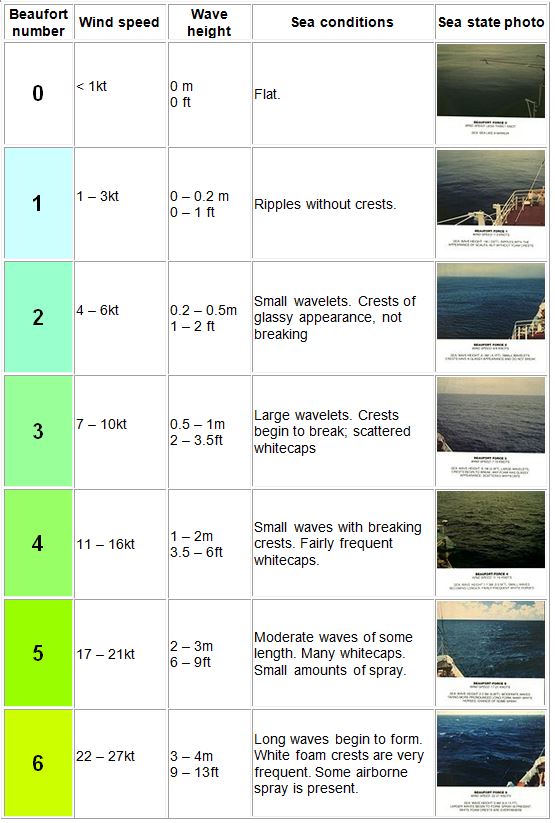 Figure 2 (a): Modern Beaufort scale (from Wikipedia)
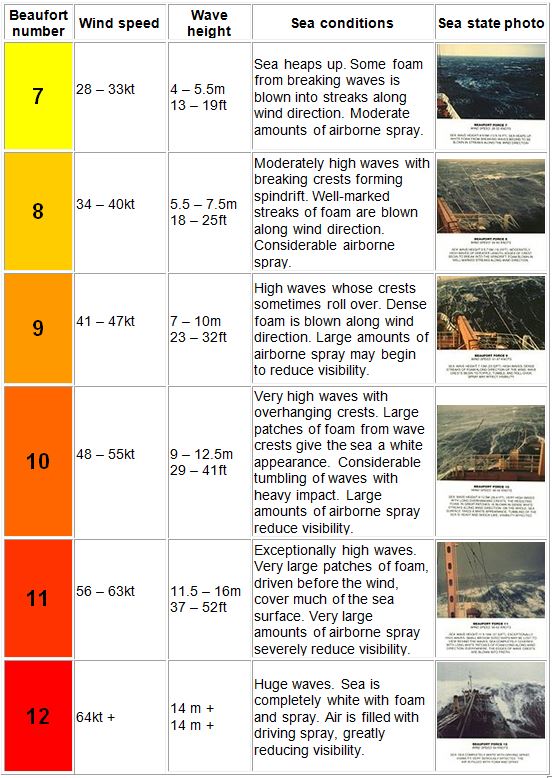 Figure 2 (b): Modern Beaufort scale (from Wikipedia)
Each Beaufort force number has expected wind speeds, wind wave heights and sea conditions associated with it. The Beaufort scale is very popular in the marine community as the condition of the sea is so important. While wave heights are given, their impact on various sized vessels depends on many other factors, such as wave period, additional swells and the depth of the water. Also, the larger waves need some distance over which to develop, giving very different wave heights for onshore or offshore winds near the coast. Because of this, a description of the sea surface is more beneficial to the mariner than just the wind wave heights alone. The World Meteorological Organization and MetService use the Douglas Sea Scale to define sea state. It was developed in the 1920s by Captain H.P. Douglas, and its purpose is to estimate the roughness of the sea (see figure three).
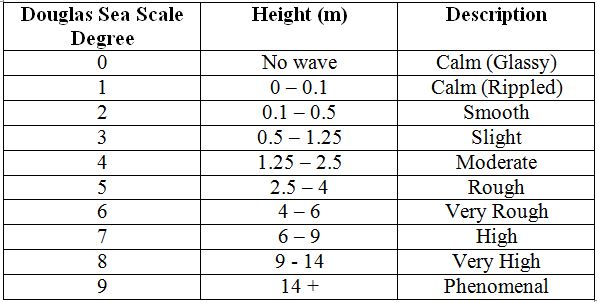 Figure 3: Douglas Sea Scale (from World Meteorological Organization)
Combining the Beaufort Scale sea state images – what a mariner would expect the sea to look like – with the expected corresponding wind speeds and the Douglas Sea Scale (figure three), you get figure four.
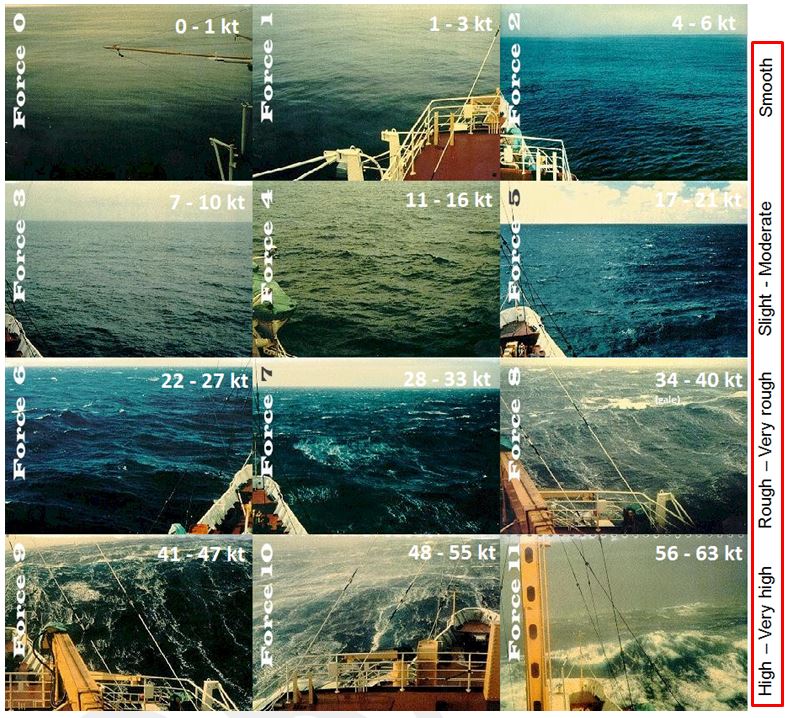 Figure 4: Relationship between the Beaufort Scale and sea state description (right hand side bordered in red).
Figure four shows the relationship between the expected sea conditions and the sea state description. From this we can derive figure five (the sea state guide at MetService) which relates wind speed, sea state and the expected wave height.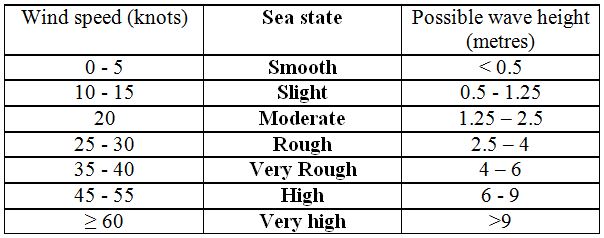 Figure 5: Sea state as a function of wind speed (MetService)
Note that wind wave heights are significantly affected by local conditions, such as whether the wind is onshore or offshore and the fetch and its duration. New Zealand’s mountainous terrain also has a large influence on the wind flow – it can vary significantly around the next headland or in the lee of the next set of hills. The wind flow, in turn, affects the local sea conditions. An offshore wind blowing from the land onto the sea is usually smooth close to shore but noticeably rougher further out because it takes a little distance for the wind to work up waves on the sea surface. It starts off generating small wavelets close to the land, then short steeper waves and then bigger less steep waves further out. On the other hand, onshore winds do not have this fetch limitation. Depending on the wind direction, the more sheltered areas of MetService forecast areas should not be as rough as exposed areas. When interpreting the sea state in a MetService forecast, the local conditions need to be taken into consideration.
Swell
Swell refers to waves that develop over a longer period of time than locally-generated wind waves, and over a larger area. Swell waves (often just called swell) are self-sustaining and can travel long distances and usually originate hundreds or thousands of kilometres away from where they have an impact. Swell waves have longer periods (the time taken for waves to pass by) than wind waves and so affect craft differently. Because no two waves (swell waves or wind waves) are exactly the same, swell height is described by:
-
Significant swell height: the average peak-to-trough height of the highest one third of the waves. This is what you’d generally ‘eyeball’ the wave height to be (see figure six).
-
Occasional wave height: 50% higher than the significant wave height. This is generally the biggest wave of a group of waves.
-
Maximum wave height: The highest reported wave height over a long duration (e.g. one day) and can be twice the significant wave height.
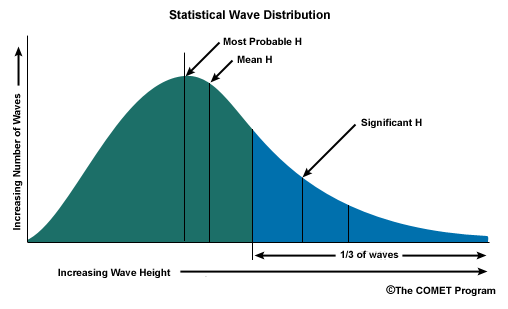 Figure 6: Statistical wave distribution (The COMET Program)
The depth of the water also has an impact on swell characteristics. As waves move into shallow water, the waves begin to interact with the sea bed. The result of this friction is an increase in wave height: this process is known as shoaling. The increase in wave steepness continues until the wave breaks. MetService uses a variety of techniques to forecast swell waves. Nomograms are an effective graphical technique to estimate characteristic wave heights and periods. Bretschneider devised a nomogram in the mid-1900s, based on very large amounts of wave data, called the Bretschneider nomogram (see figure seven).
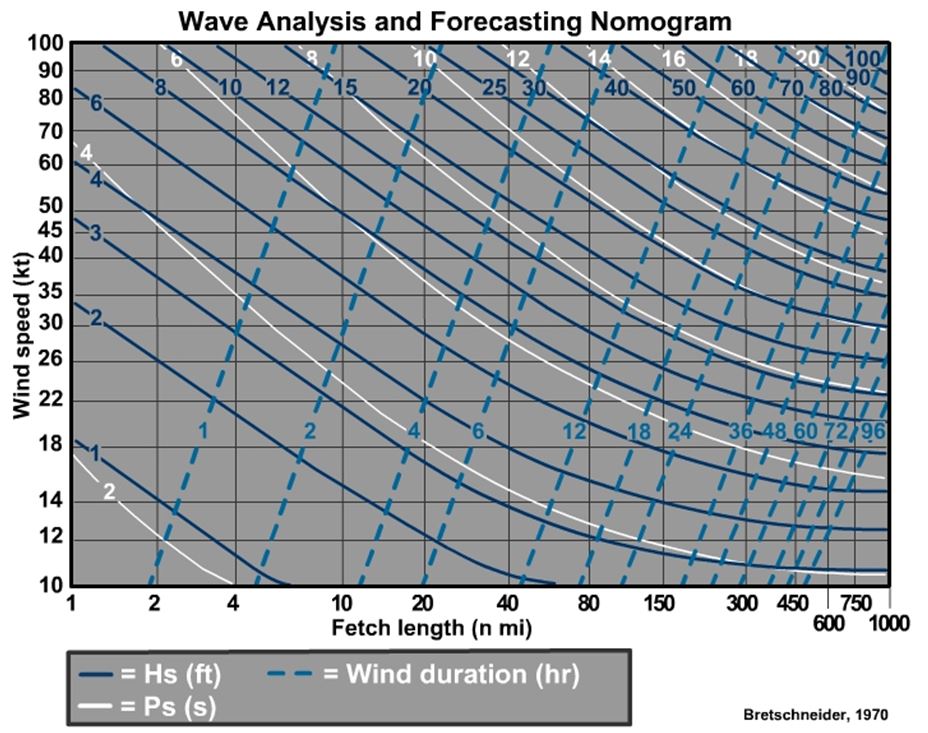 Figure 7: Bretschneider nomogram (Bretschneider, 1970)
In figure seven, the vertical and horizontal axes display wind speed (knots) and fetch length (nautical miles) respectively, the white lines are wave period (seconds), the solid dark blue lines are wave height (feet) and the dashed blue lines show the duration of the wind within the fetch (hours). Once a mariner or forecaster has determined the wind speed, fetch length and wind duration, the wave height and period can be estimated. Example 1: Consider a wind of 30 knots blowing over a fetch of length 80 nautical miles for a duration of 12 hours. Using the Bretschneider nomogram, follow the 30 knot line across until you arrive at one of the constraints. In this case, you reach the fetch length constraint before you get to the time constraint. At the intersection of 30kt and 80nm, the significant wave is read off as approximately 10 feet/3 metres (yellow line) in height with a period of 7 seconds (orange line).
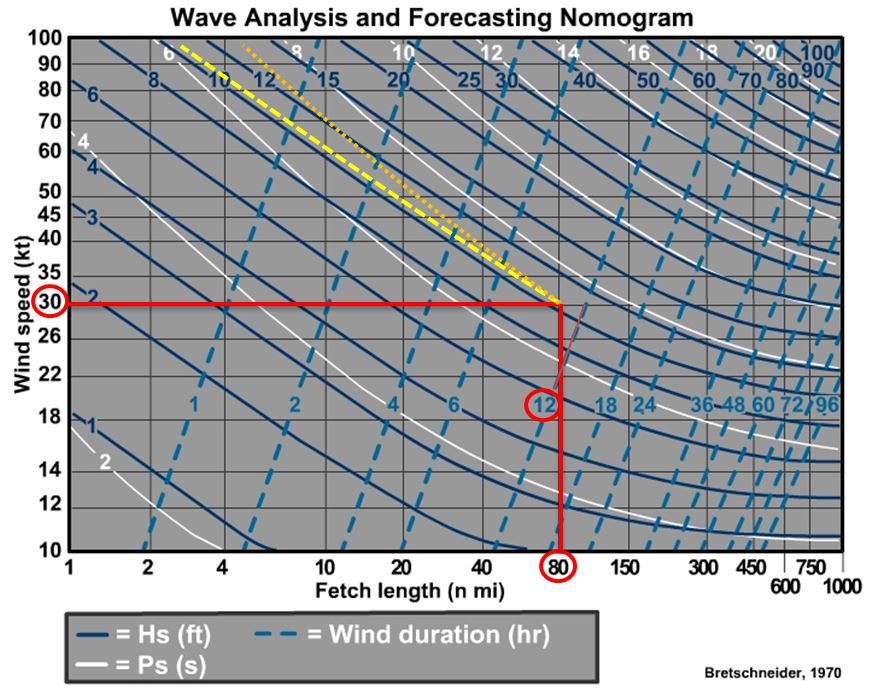 Figure 8: Example 1 Bretschneider nomogram.
Example 2: Consider a wind of 60 knots blowing over a fetch of length 600 nautical miles for a duration of 24 hours. Using the nomogram, follow the 60 knot line across until you arrive at one of the constraints. In this case, you reach the time constraint before you get to the fetch length constraint. At the intersection of 60kt and 24 hours, the significant wave is read off as approximately 45 feet/13.7 metres (yellow line) in height with a period of 15 seconds (orange line).
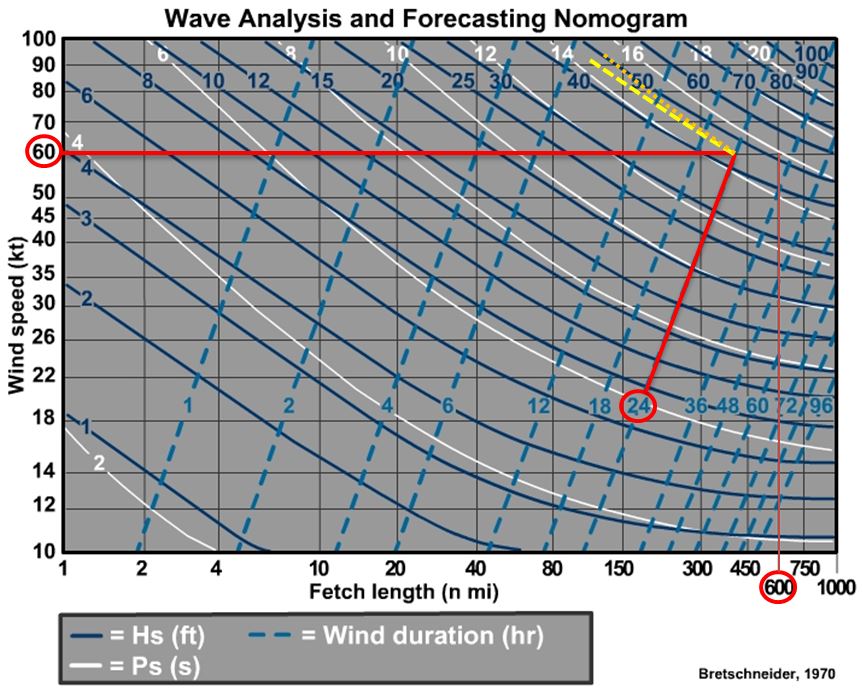 Figure 9: Example 2 Bretschneider nomogram.
At MetService we use various global wave models as swell guidance. The model with the greatest amount of data is created by the European Centre for Medium-range Weather Forecasts (ECMWF). An example of this guidance is shown in figure ten.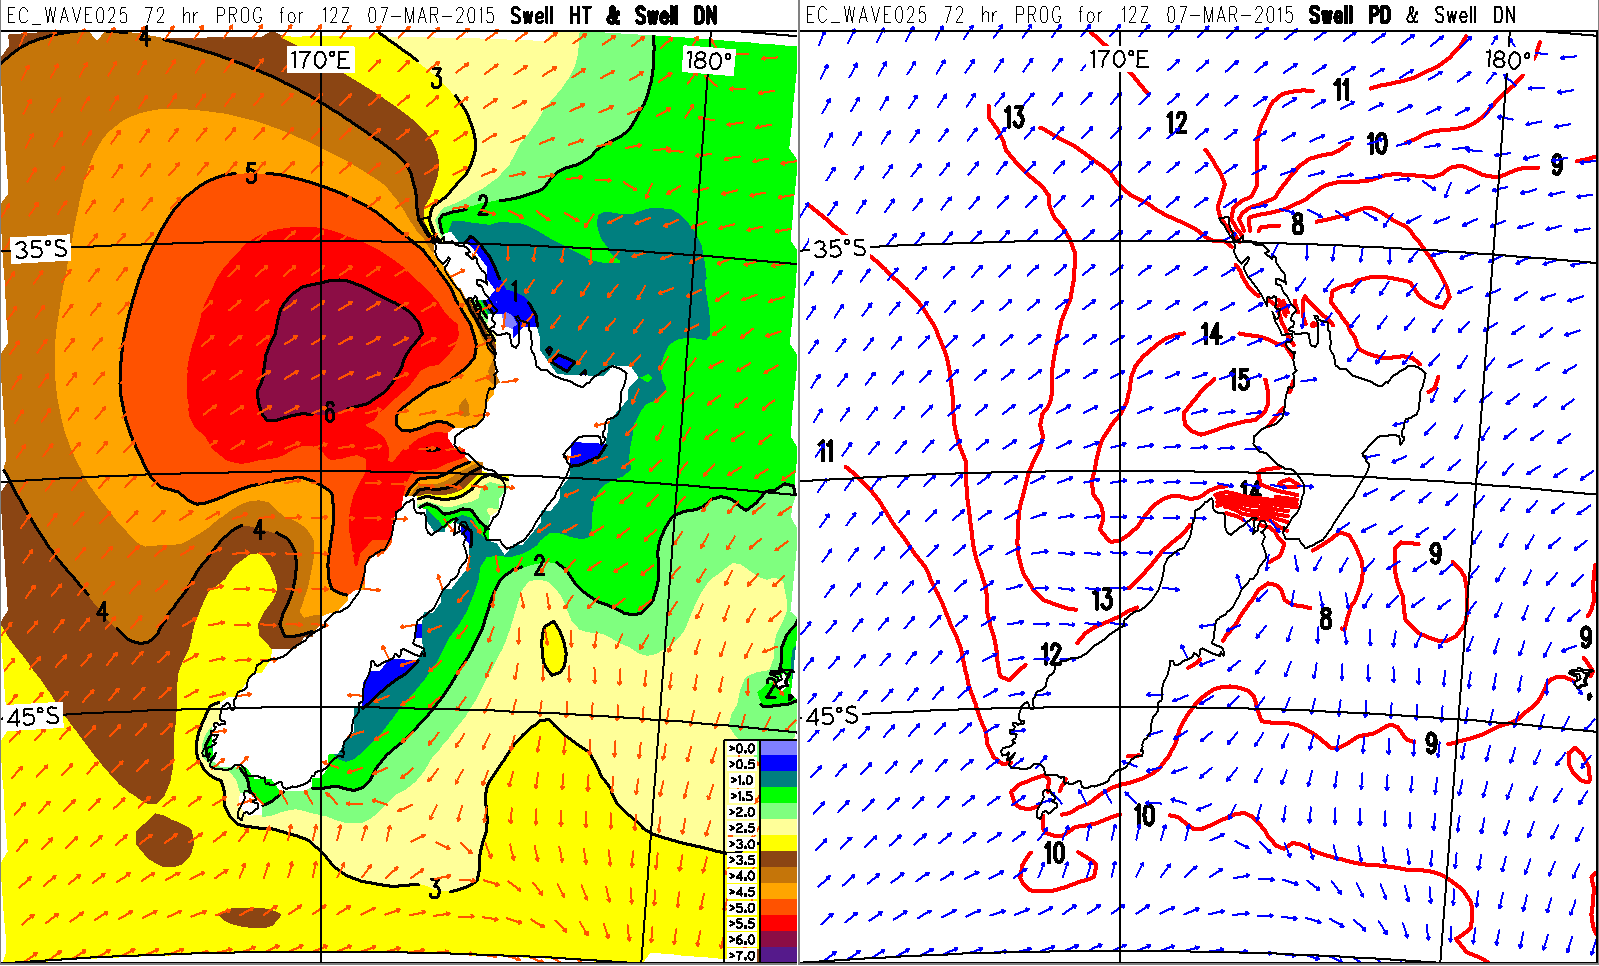 Figure 10: MetService ECMWF swell guidance.
Left - Significant swell height (m) and direction Right - Dominant swell period (sec)
Sea and Swell
It’s possible to have either a significant sea state or a large swell and not have the other. For example, consider the following weather situations that can be encountered around NZ:
-
A large depression deepens east of the North Island while the country sits under a ridge of high pressure. Winds off the East Coast may be only 10 knots, so the sea is slight, but the deep depression generates large easterly swell waves that reach the shore.
-
A small depression moves rapidly over the lower South Island. Winds in Dunedin briefly rise to a northwesterly gale, so the sea is briefly very rough. However there is insufficient fetch and duration to generate large swell waves. As soon as the wind eases, the conditions improve.
It is just as possible to have both a significant sea state as well as swell. When we combine the wind waves and the swell waves this is what we call combined waves.
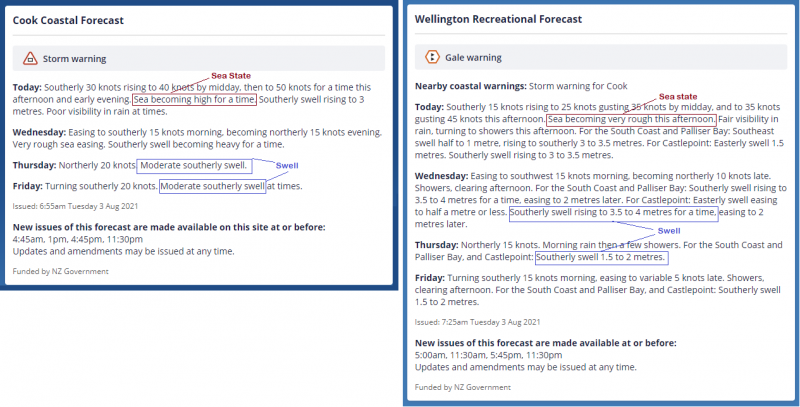
Forecast Examples
Here are examples of a coastal and recreational marine forecast that contain both sea state and swell forecasts.
Warnings
MetService has a swell warning service arranged with particular regional councils around New Zealand coastlines. This is to cover such hazards as erosion, waterfront safety and infrastructure inundation. The warning criteria have been set by the individual councils and are different for each area; most have a threshold of around 3.5m in height, with some more sensitive thresholds set according to other meteorological conditions such as atmospheric pressure and wind strength. Although swell is strictly the determining factor, in practice it is combined waves (including all landward swells and the contribution of wind waves) that are used as the forecast parameter.