Years ago, I heard the wife of a lighthouse keeper talking on the radio about the weather at Puysegur Point, on the south coast of Fiordland, where she and her husband had been stationed for a time. Six months or so before they arrived there, a fishing boat had gone down in a storm with all hands. One day, as she walked along the black stony beach, something white caught her eye. Bending over, she picked up a single human tooth. She could not be certain it came from one of the lost fishermen but it symbolised for her the little that the sea gives back after it unleashes its fury on a small boat.
When I told this story to a retired lighthouse keeper I met a couple of years later, he countered with another about strong winds. Because Puysegur Point is so isolated, successive keepers farmed sheep in paddocks near the lighthouse in order to provide themselves and their families with fresh meat. As extreme winds were common, sheep were often blown over the cliffs and onto the rocks below. Eventually the keepers switched to cattle, as they were harder for the wind to dislodge.
The reason that the winds near Puysegur Point are frequently the strongest over the country is because it is located near the southern end of the Southern Alps. When westerly winds slam into the mountains, not all the air manages to rise over the ridgeline. Some pours around the end of the mountains.
Winds from both the northwest and southwest blow fiercely on this coast, but a northwest wind ahead of a front is the worst, for two reasons. First, the wind blows perpendicular to the Southern Alps. Second, as the air approaches New Zealand, the progressively colder sea surface cools it from below. This makes the air more stable, and so resistant to rising over the mountains, causing a greater proportion to flow around the Fiordland end of the Southern Alps.
These strong winds also show up clearly in measurements taken by a satellite borne instrument known as a scatterometer. This machine emits pulses of microwave energy and measures the returning signal reflected from the sea surface. The strength of the return signal depends on the size of the small capillary waves on the water, which in turn depend on the wind strength.
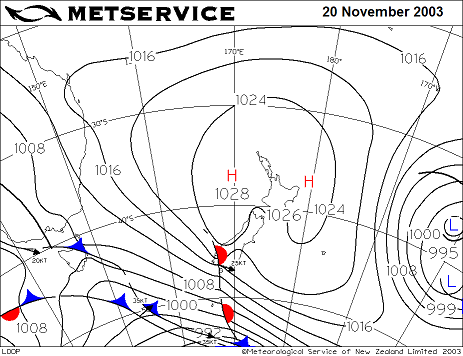
A good example of this effect occurred on 20 November 2003. The scatterometer winds in the map below show a stretch of 50 knot winds (solid triangles ) more than 100 kilometres long with a few readings of 60 knots. The associated weather map shows the isobars close together over southern Fiordland.
More examples of scatterometer winds can be found on NOAA's QuikSCAT site.

QuikSCAT Scatterometer winds 20 November 2003

Weather Map 20 November 2003