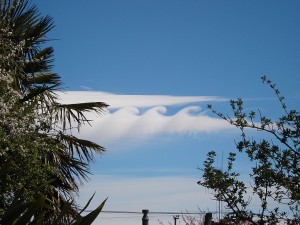
The image below shows some very nice Kelvin-Helmholtz instability made visible by cloud.
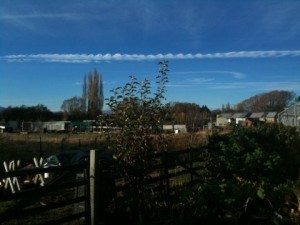 This was taken by Norman Robinson on an iphone, 8 May 2010, seen from Ophir in Central Otago at 16:16 at latitude 45.11S, longitude 169.60E at altitude 302 metres.
Here is a colour-enhanced detail from the above image:
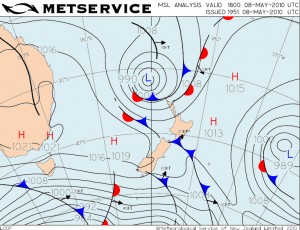
 The weather map for that day showed a large low pressure system slowly making its way across the north end of North island, and a rather flat ridge of high pressure on the south of this cradled across Central Otago.
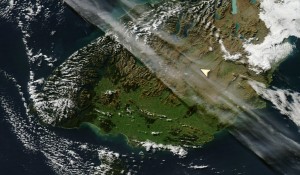
 Courtesy of NASA, the MODIS satellite image (for close to the time the cloud image was taken) showed some filaments of cirrus clouds streaming out due to the upper winds, which were coming from the northwest over Central Otago. Click on the image here to link to the full scale image
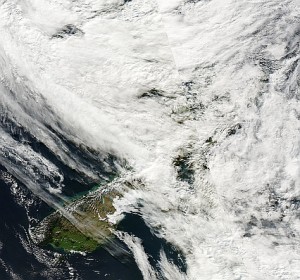 Here are the zoomed-in details over Central Otago with a small arrow showing the vicinity where the image was taken.
 These clouds show waves rolling along and breaking in the sky, similar to the way that waves behave on the sea. It occurs when the change in wind across the boundary between two fluids is so much that steady simple ‘laminar’ flow breaks down and becomes turbulent, and the two fluids mix, with regularly spaced eddies. The name that has been given to this phenomenon is Kelvin-Helmholtz instability, after Lord Kelvin (William Thomson, 1824-1907) and Hermann von Helmholtz (1821-1894). This is just one of many types of turbulence in the atmosphere.
The following section is for meteorological boffins: The weather balloon released from Invercargill at noon that day took a sounding that measured the temperature, moisture, density and wind profiles. MetService forecasters use a specially designed diagram called a Tephigram to help grasp the impact of all this data, and the one attached below has a yellow-red vertical bar attached. This bar uses a derived parameter, Richardson’s Number (or Ri), to show the likelihood of turbulence. Red zones have low Ri and here the wind changes are sufficient to dislodge stratified layers and thus be turbulent. It is unlikely that the balloon went near the cloud seen in the image above, but the sounding can be taken as representative of the whole region. This means the red bar near 350 hPa can be taken as a indicator that the Kelvin-Helmholtz instability layer was at a height of around 8km above ground level.
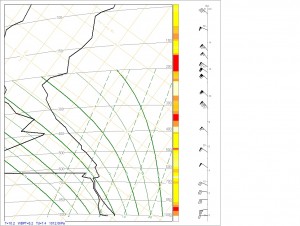 Invercargill weather balloon, 12pm 8 May 2010 NZST.
Temperatures are given by the graphed line on the right, dewpoint to the left, and winds at different altitudes are shown on the right hand side; each barb=10 knots, pennant=50 knots.
These breaking waves were made visible thanks to the layer of cirrus cloud. They can occur whenever the wind and air density change fast enough, as found near a jetstream - a river of rapid moving air aloft. Often these breaking waves occur in areas which are cloud free. Airline pilots have a healthy respect for such areas and call them CAT, or Clear Air Turbulence. Special aviation weather maps are routinely prepared by MetService to forecast hazards such as CAT, and when a pilot encounters a CAT area a report is sent to alert all aviators.
Thanks to Norman Robinson for agreeing to share this image. Cloud-watching can be a fascinating and useful hobby. Identifying the processes at work in the changing sky and linking these to changes in the barometer and isobars on the weather map allows us to understand what is happening now - all the better to predict what will happen next.
Addendum: Here is another wonderful image of breaking waves in the sky - this was sent in by Carol Diehl and seen from west Timaru on 22 Sep 2010
