Published Dec 2009
New Zealand is sometimes affected by a weather pattern which feeds subtropical air onto the North Island, or even over the whole country. In this subtropical air people often comment how 'muggy' it is. In this Blog Meteorologist Jon Tunster explains the difference between relative humidity and mugginess.
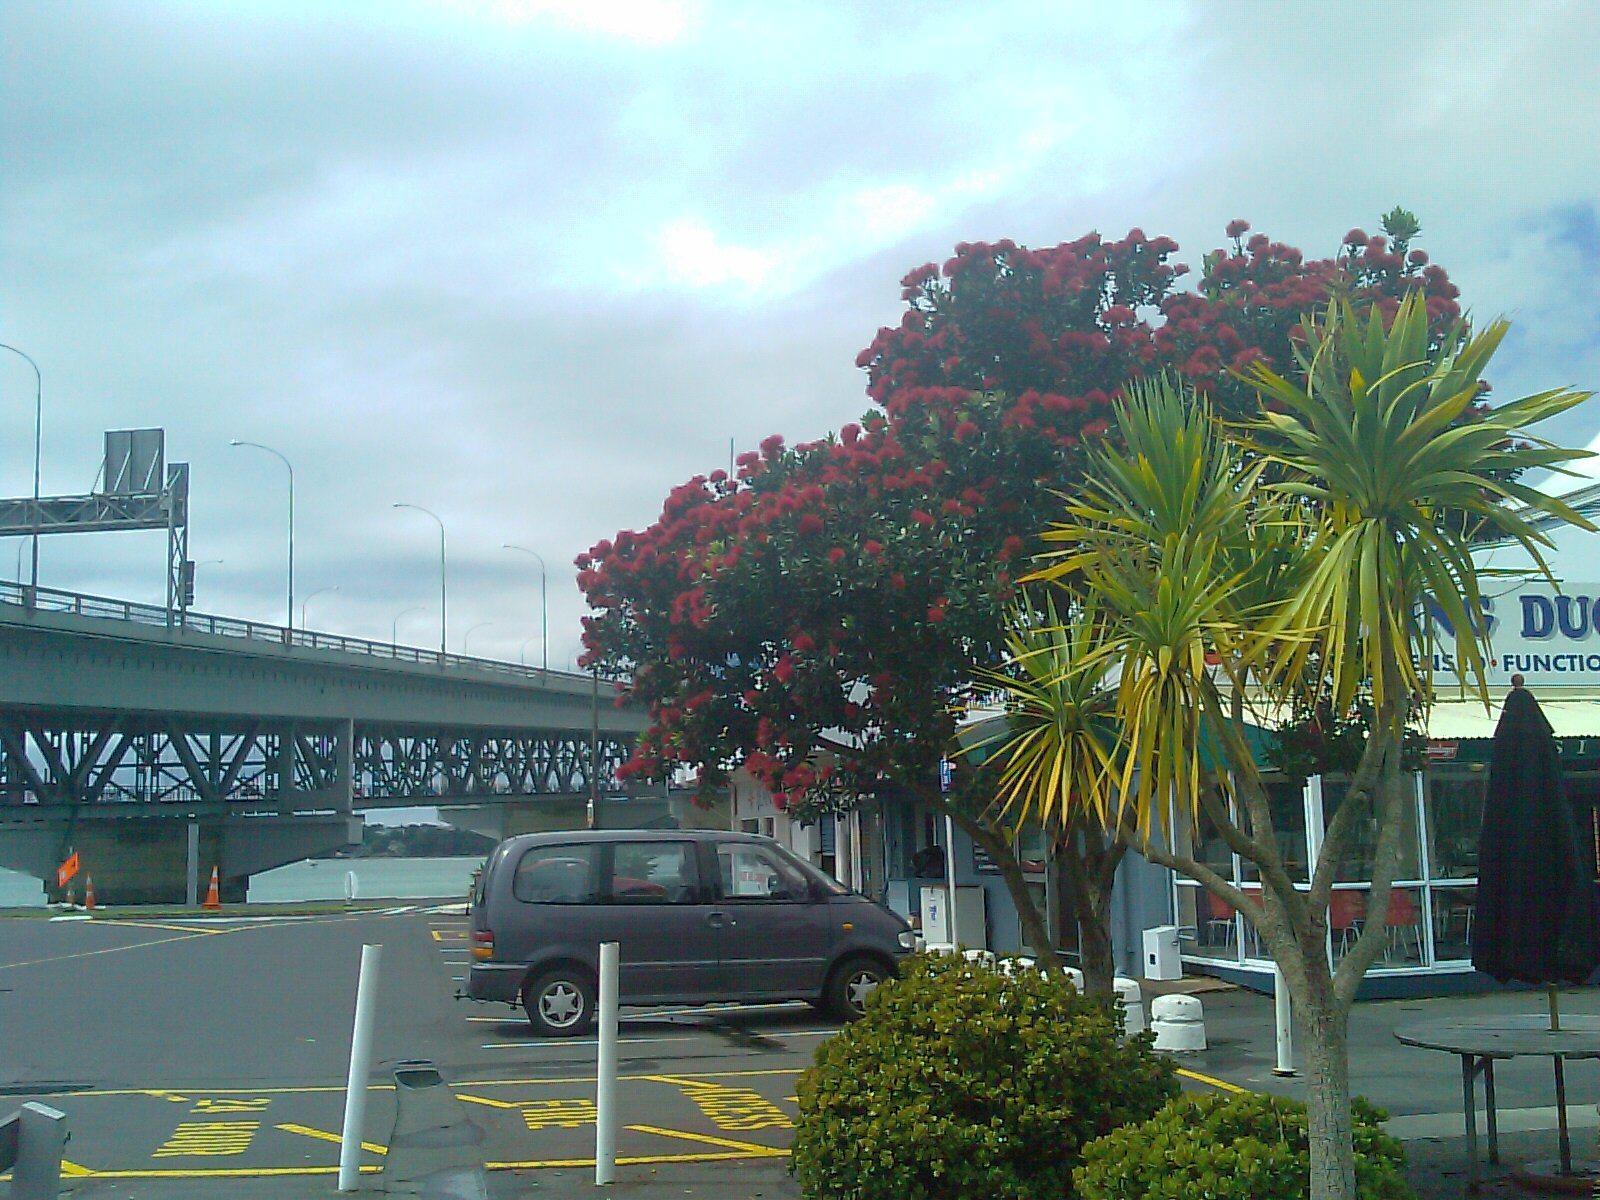 Pohutukawa blossom , 3 Dec 2009
Pohutukawa trees revel in the warmth and high humidity. This one in the photo above, near Auckland Harbour Bridge, is near full bloom in December!
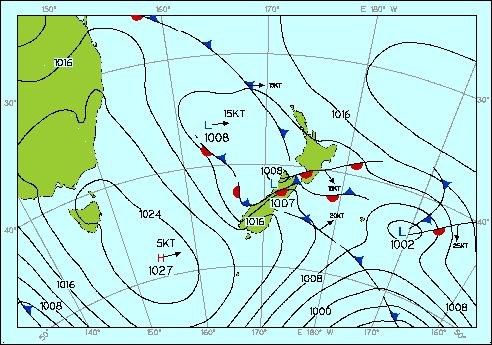 Weather pattern , 1pm Wed 2 Dec 2009
On the weather map shown here, for 1pm on Wednesday in the middle of the first week of December 2009, some typical signs of summer can be seen: The incoming high pressure system is, for a while, at near 45°S. The low pressure system in the Tasman Sea had transported some warm air from the subtropics on to northern New Zealand, raising the humidity. (The following week, the high returned to its typical El Nino summer latitude of 35°S, taking the subtropical warmth with it).
The relative humidity was “flat-lining” at 100% in many places all around the country during this week. The bottom part of the graph shown here gives the relative humidity at Whangarei, Auckland, Wellington, Christchurch and Dunedin for comparative purposes.
Out of all these locations, Christchurch was the place hugging 100% the most, so did it feel the most humid?
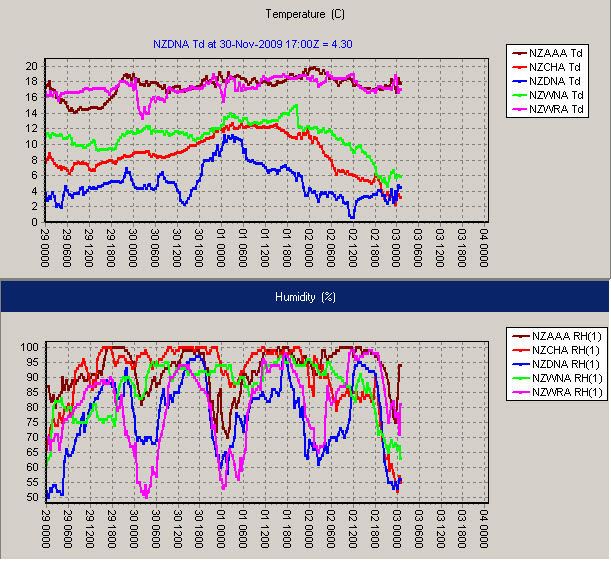 Dew point (degrees C) above and Relative Humidity % below for WRA Whangarei, AAA Auckland, WNA Wellington, CHA Christchurch and DNA Dunedin . Timesteps are in UTC so 010000=1pm Tues 1 Dec 2009, 020000=1pm Wed 2 Dec, etc
The answer is NO.
Relative humidity measures how close the air is to saturation (see here for more) but not necessarily how muggy it feels to people. In cool air, saturation is reached at relatively low amounts of water vapour – when the air temperature is below around 8°C your breath can often contain sufficient moisture to produce saturated air or misty cloud - at standard pressure that’s 6 g of water vapour per kg of air, and this has been the amount of water vapour in Christchurch at times during this weekin December 2009. While places such as Auckland or Whangarei had around 12 g of water vapour per kg of air – twice the 'humidity' of Christchurch, even when the relative humidity is 100%!
A better index for measuring mugginess is the dew point … the temperature at which, if cooled, water vapour from the air will condense on to a surface such as grass. This condensation requires 100% relative humidity and occurs when the air temperature equals the dew point. The air feels muggy when we get hot and sticky - and that’s when 1) the air is warm enough to make us perspire, and 2) the air contains sufficient water vapour to interfere with the evaporation of our perspiration and not allow us to cool down much from that.
So mugginess depends on both heat and humidity. In the graph shown above the dew point is plotted on the upper table. Notice how Whangarei and Auckland have both been on top. They have often been having nearly the same dew point and so have been nearly equally muggy. However, only Auckland has, occasionally at night, been flat-lining at 100% relative humidity. Even though both places are equally muggy, Whangarei has slightly warmer air than Auckland and thus slightly lower relative humidity. The dew point temperature is a great mugginess parameter, for it combines heat and humidity into one number. Wikipedia has more information about the human perception of mugginess depending on the dew point, ranging from extreme discomfort above around 24°C, to noticeably humid from 16°C-18°C, to noticeably dry below 10°C.
Hopefully this blog has helped to clear up any misconceptions between relative humidity and perception of mugginess. Here’s a photo of a pohutukawa tree at Oriental Bay, Wellington taken on 6 Dec 2008, and a year later on 7 Dec 2009.
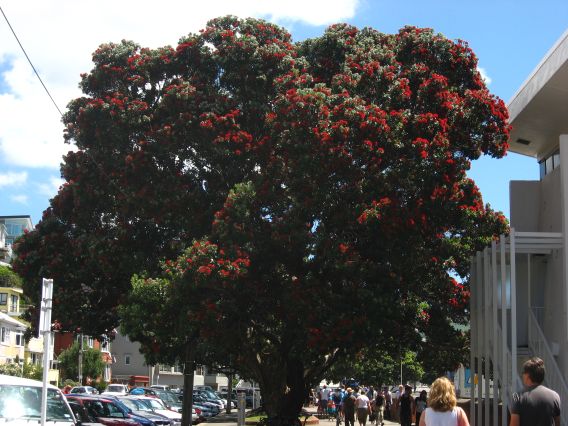 Oriental Parade Pohutukawa 6 Dec 2008
Oriental Parade Pohutukawa 7 Dec 2009
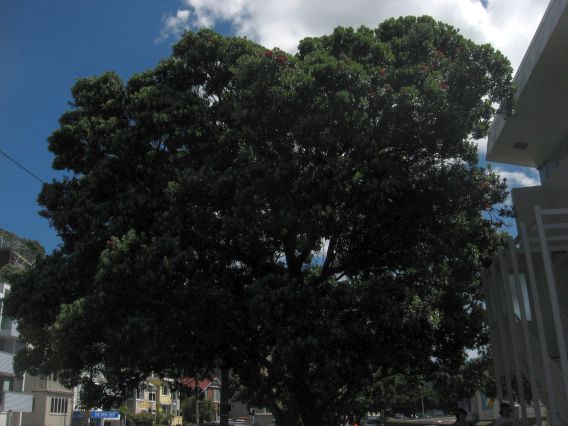
Flowering is considerably delayed in Wellington 2009, maybe due to the cold October? The name for the study of plant (and animal) life cycle events in relation to the changing seasons is Phenology. These photos dramatically illustrate the difference between the start of a La Nina summer (Dec 2008) and an El Nino summer (Dec 2009). The chilly air and soil in October is indeed a likely source of the delayed flowering of the pohutukawa.
Blog Editor, Lisa Murray