If you look back to the Towns & Cities forecast tabs or the Rural forecasts, you will notice that at the bottom of the 10 day forecasts is this phrase: “Forecasts and temperatures for days 1-5 are produced by MetService meteorologists. Forecasts and temperatures for days 6-10 are automatically generated by MetService's computer weather modelling system.”
What does this mean?
For the first five days in the forecast, the information in the forecast has been written by one of the forecasting team. MetService employs almost 60 meteorologists, who work in shifts to cover the weather 24 hours a day, seven days a week, every day of the year. Observations, radar images and information from satellites are used by the meteorologist on duty to update the forecasts for the short-term (say the next few hours to a day).
By looking at what is happening now, the forecasters can have a fair idea of how weather systems are moving and where they are heading. You can see this for yourself by having a look at the radar images on metservice.com and watching how showers develop and move, or by watching a band of rain march up the country. Observations are great for watching weather that has already happened, but much of the time we are interested in what is going to occur further ahead - sometimes even when the system bringing the weather hasn’t yet formed.
To do this, computers use complex mathematical equations to model the physical atmospheric processes. These equations are solved by using incredibly powerful computers capable of computing millions of equations every second. The information from these can then be used as guidance by the forecasters. The output produced by several different global weather models from a number of institutes around the world are used on the forecasting bench to create the forecasts for the first five days, with a trained meteorologist translating the data into forecasts. After day five the forecaster steps away and the computer takes over, and the longer range forecasts are produced without the benefit of human intervention.
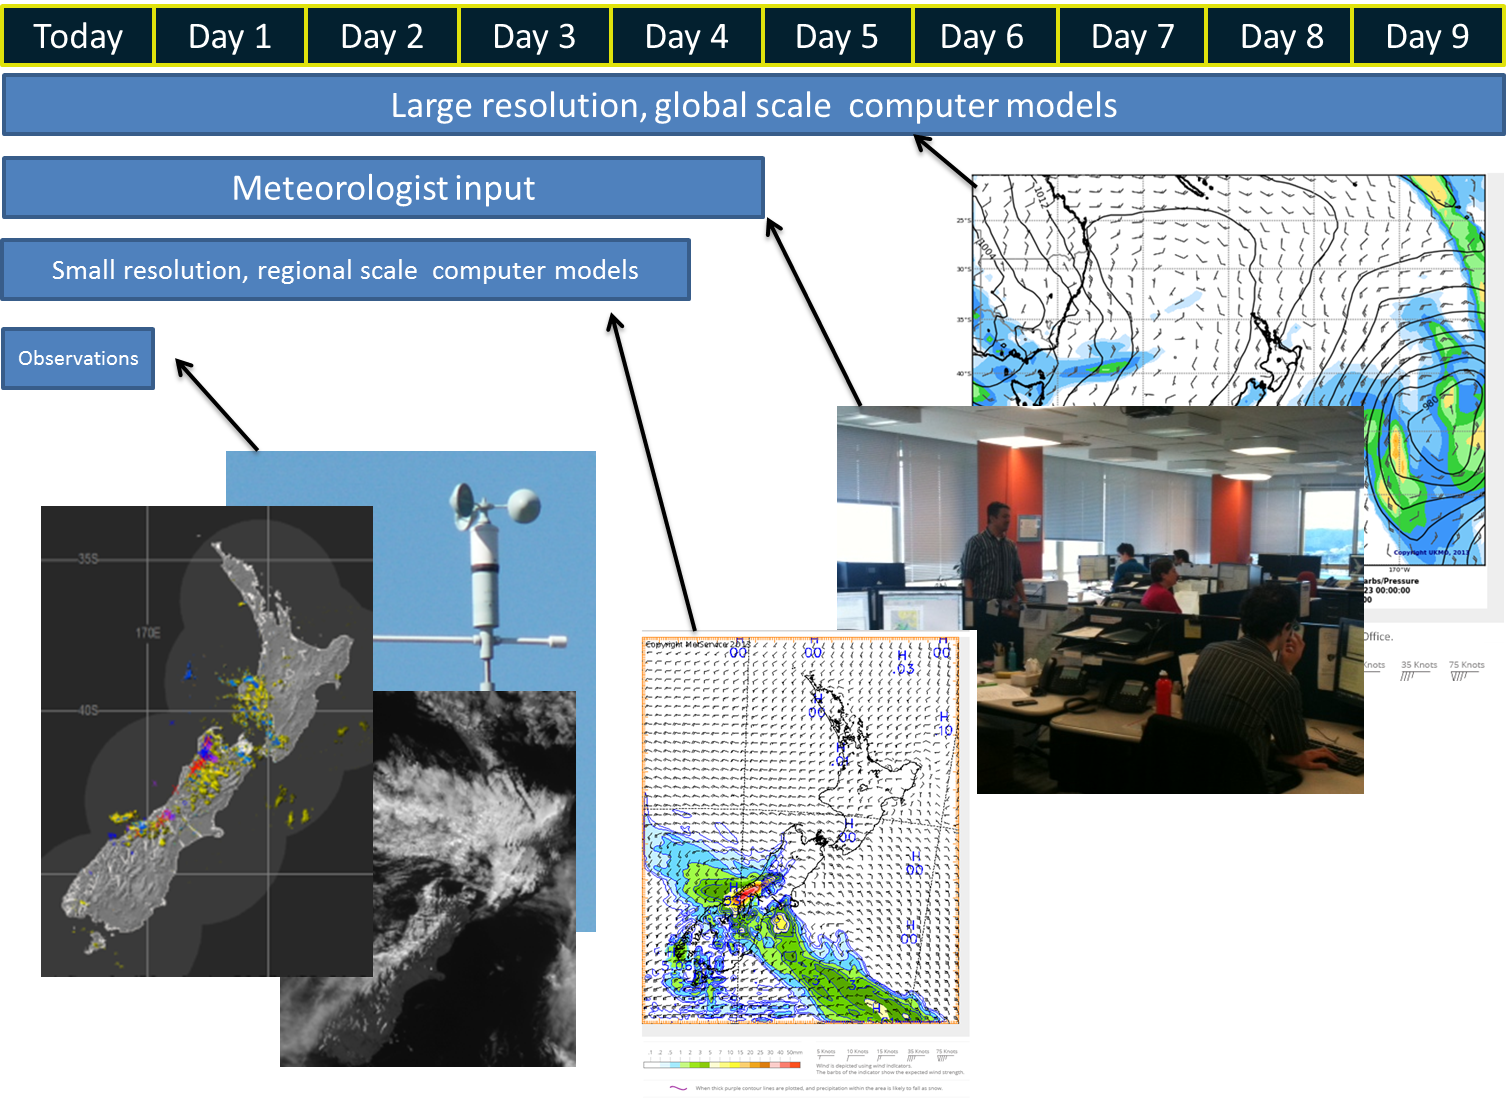 Many different elements are combined to make a forecast. This image shows there is more information avaliable for the shorter range forecasts compared to days further into the future.
How accurate are the forecasts?
Mother Nature is a tempestuous animal, and even with the best forecasting team, the most powerful computer models and the latest weather observations, weather forecasts can never be perfect. Looking back over the last year, the accuracy of the short-term forecasts for temperature is around 81% and for rainfall 85%. So do these stats count for the longer range forecast as well? Forecasting the weather into the future becomes harder the longer out we go.
As we head into the future, the uncertainties in the forecast grow, leading to less confidence. Because of the increased level of uncertainty involved, the accuracy of the longer range forecast reduces. For example, this chart shows the rainfall accuracy percentage for one computer model over the last few months. This graph is based on one computer model as the base forecast source. “Accuracy” is defined in the following manner: The forecast is correct if a) no rain/shower was forecast for the day and no precipitation was recorded at the observing site, or b) rain or showers were forecast and there was at least a trace of precipitation recorded at the observing site. If either of these conditions were satisfied the forecast was considered accurate.
As you can see, the computer forecast for day zero (today) is about 20 percent better than the computer forecast for day nine.
So what causes the drop in accuracy?
Every calculation that is made introduces an element of uncertainty into the forecast and so the more calculations you need to make, the more the uncertainty increases. The diagram below might help explain a little better.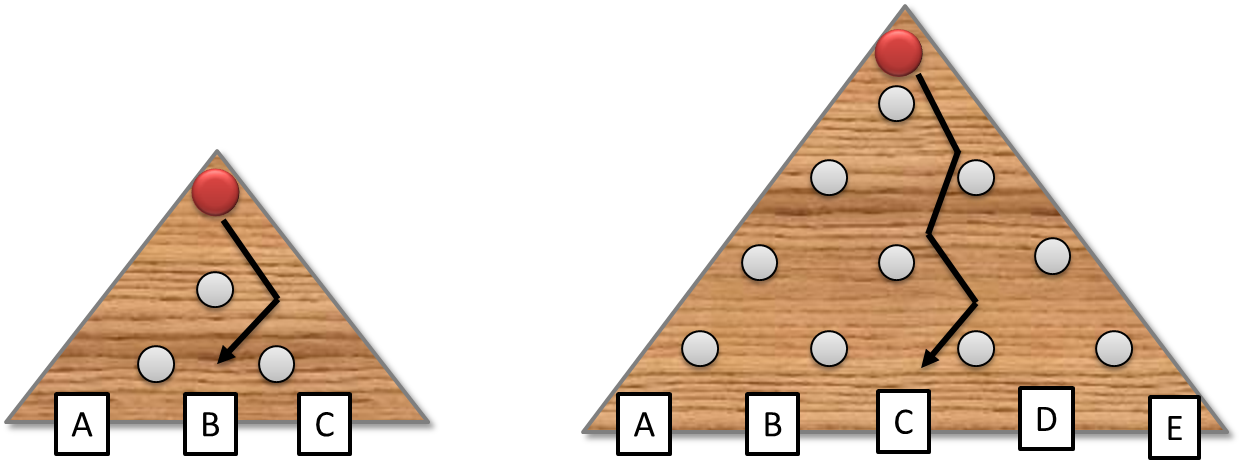 Imagine dropping a ball down a pin board, as it meets a pin it can go to the left or right. After two levels of pins the ball would be in one of three spots and the route it takes one of four possible ones. If we increase the levels of pins to four, the number of outcomes increases to five and the number of possible routes the ball can take also increases.
It is a very simplistic model but if we imagine that each level of pins relates to a time step in the model, small changes at any time step can make a difference to the final outcome.
As mentioned earlier, the amount of computing power needed to run a model or numerical weather predictions (NWP) is huge and a computational balance has to be made between the area covered and the length of time that it goes into the future. For the first 84 hours of a forecast, the NWP have a spatial resolution of 8km over an area slightly larger than New Zealand; this is the model you can find here The five day rainfall models on metservice.com are from NWP that cover the globe, but instead of having a point every 8km, the resolution of these models is around 50km. These models are good for picking developing systems and broadscale features, but because of the large resolution they struggle to pinpoint smaller features like isolated showers and sea breezes.
Timing
As with comedy, the secret of success in forecasting is timing, and this is another factor that can be very variable the further into the future we head. For example, take these images which show the same forecast period but were produced by three consecutive model runs 12 hours apart:
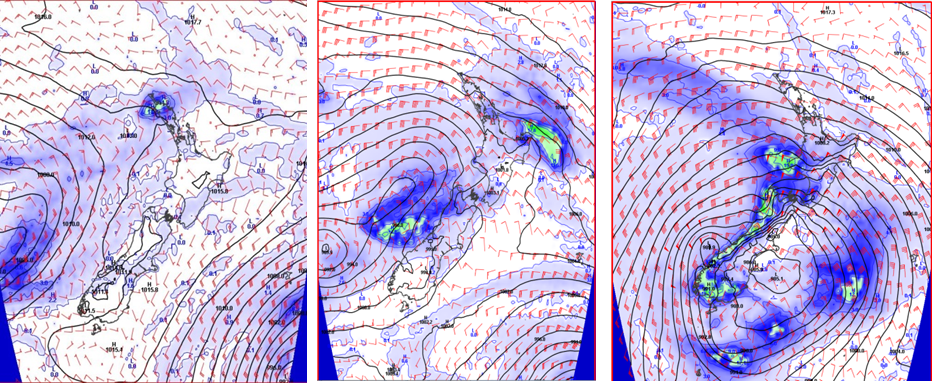 These forecasts, showing pressure, rainfall and upper level winds, are for the same time but from different computer model runs. Although the story is similar, the timings are very different, meaning the difference between a wet day in Southland and a dry one. As we get closer to the forecast day, the differences between computer models and model runs tend to be smaller and we can be more confident about the forecast.
As you can see, the story for all three forecasts is the same: an area of low pressure over the Tasman Sea moves eastwards across New Zealand bringing rain and showers. The difference comes in the timing: the earliest model run on the left shows the rain (the blue shaded areas) mainly out the west; the next run pushes the rain onto the West Coast; and the latest run pushes the rain further still onto the country. Getting closer to the forecast day, these changes in timing and the variation in model runs tend to be smaller. With a forecaster sitting between the raw model output and the final forecast, these differences can be minimised.
So how good is the long range forecast?
The longer range forecast is really a guide based on the best model run we have to date, but it is worth remembering that it is still just computer output - without the benefit of having been reviewed by the MetService forecasting team - and being prepared for the forecast to change as we get closer to the day of forecast.