Written by Georgina Griffiths, Metservice Meteorologist.
The wisdom of the crowd
At a county fair in Plymouth, England, in 1906, several hundred fair-goers entered a contest to guess the weight of an ox. The average guess was extremely close to the true weight of the beast – even though some of the individual estimates were wildly off the mark! In addition, the average guess was closer than the separate estimates made by cattle experts. A statistician of the time, Sir Francis Galton, made the observation that the ‘wisdom of the crowd’ was more powerful than any individual member within it.
Ensemble forecasting
Weather forecasting today also employs this technique, by using a group (or ensemble) of weather models to predict the state of the atmosphere out beyond the usual six or seven days. The average outcome of the ensemble group often validates well, even when run out for three or four weeks. This is especially true for temperature forecasts, and for very ‘strong’ climate signals (e.g. big Highs or deep Lows, very dry or very wet conditions).
But how does this work?
Every weather model starts out with a slightly imperfect estimate of the current state of the atmosphere (what is going on right now). The weather model takes the initial weather conditions and forecasts them out through time, following the laws of physics. But the uncertainties in the initial conditions of the atmosphere (in other words, the errors) grow larger through time. Even though the skill displayed by weather forecast models has improved enormously over the last few decades, mainly through reducing this initial condition uncertainty, there remains a limit. This means that an individual weather model typically becomes inaccurate after about a week or so (depending on the weather situation and how well the model initialises). Ensemble forecasting actually uses the fact that weather models start out with an imperfect estimate of what is going on ‘right now’, to advantage! If you run a group of weather models, they all initialise (capture the current weather) slightly differently. Some of them will underestimate, some overestimate – rather like the fair-goers guessing at the weight of the ox. Overall, as a group, ensemble forecasts show skill (accuracy) beyond a week.
Ensemble guidance is used in many ways
At MetService, ensemble guidance is used in several different ways. Sometimes ensembles are used to assess certainty in weather systems (yes, within the seven-day window). For example, ensembles allow us to gauge confidence in Tropical Cyclone tracks (Figure 1). If most of the group show much the same path, with a narrow track trajectory, track confidence is higher.
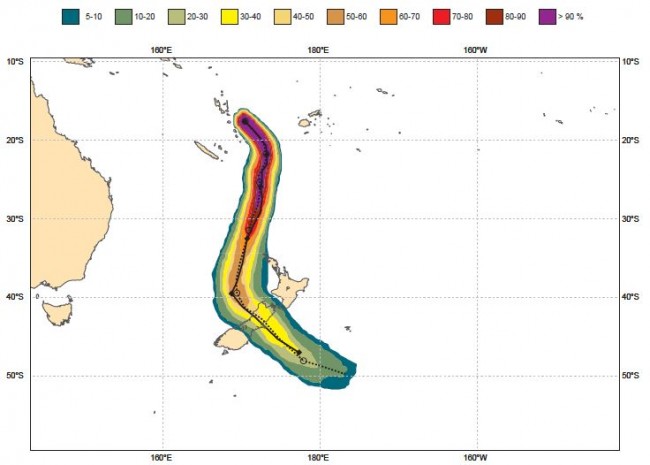
Figure 1: A Tropical Cyclone track ensemble probability plot from ECMWF (the European Centre for Medium-Range Weather Forecasts) over a five-day period. The colours correspond to the percentage of ensemble members tracking through a specific grid-point. For example, purple colours show where more than 90% of group members track the Cyclone. In this case, the track is quite ‘tight’. The dotted black line is the ensemble average track, and the solid black line shows the track given in the latest operational ECMWF weather model. The forecast Cyclone position is overlaid with a large dot every 24 hours. Confidence in the track of this Cyclone would be fairly high, since the ensemble members and the operational ECMWF weather model show very similar trajectories, and very similar speeds (compare the filled dots of the operational weather model with the open dots of the ensemble average).
MetService also uses ensembles in its monthly guidance, using pressure, temperature and rainfall information, produced by ensembles to formulate the rural outlook. One way to present the data of a forecast ensemble is as weekly anomalies (difference from what is usual for the time of the year). If, for example, most of the ensemble members show lower than usual pressures over the country in week one, with this signal weakening in week two, and shifting eastwards in week three, then useful information can be gleaned (Figure 2). The remaining ensemble members might have random outcomes, but in most cases, the rough ‘sequence’ of low pressures dominating over New Zealand, then weakening and gradually shifting eastwards, is what is likely to unfold during the month.
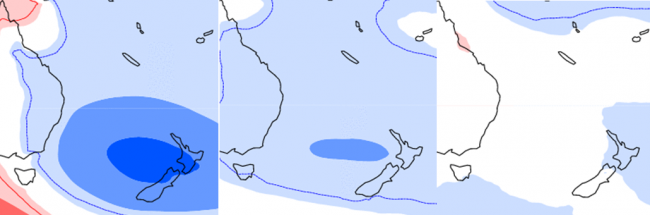
Figure 2: An example of ensemble output from ECMWF (the European Centre for Medium-Range Weather Forecasts), showing ensemble-average forecast weekly mean sea level pressure anomalies (departures from normal) over New Zealand for week one (left), week two (centre) and week three (right). Blue colours show lower pressures than normal; red colours show higher pressures than normal.
When the ensembles show a very consistent story-line (that is, the spread is small), the forecast tends to have higher confidence. One situation where ensembles can show good skill is with large, slow moving Highs – and this is important during drought situations. MetService issues its four-week (ensemble) forecast on, or just before, the 1st of each month. The latest forecast can be found at here and you can also sign up to get it delivered regularly to your inbox. It is important to note that ensemble forecasts really are ‘big picture’ in nature – since they extend out several weeks. For example, a relatively ‘cool and dry’ four-week forecast for your part of the country doesn't rule out a wet day or a warm afternoon. It just means there is an expectation that the month as a whole will be cooler and drier than is the norm. Always bear in mind that an ensemble forecast is given relative to what is ‘typical’ at your place, for the time of year. When strong signals are forecast, then you can plan accordingly, while still keeping abreast of the regular weather forecasts and warnings at www.metservice.com.