Besides the coastal waters, the MetService forecasting team produces marine forecasts for a number of smaller areas where there is a lot of recreational boating activity. These forecasts are routinely issued four times every day; they are monitored continually and updated more frequently if conditions warrant it.
Recreational Forecasts
The recreational forecasts are written for high-use recreational areas: Bay of Islands, Auckland, Coromandel, Bay of Plenty, Hawke Bay, Kapiti, Mana, Wellington, and Christchurch.
Blue shading indicates the area, or Orange if there is currently a Warning of Advisory for the region.
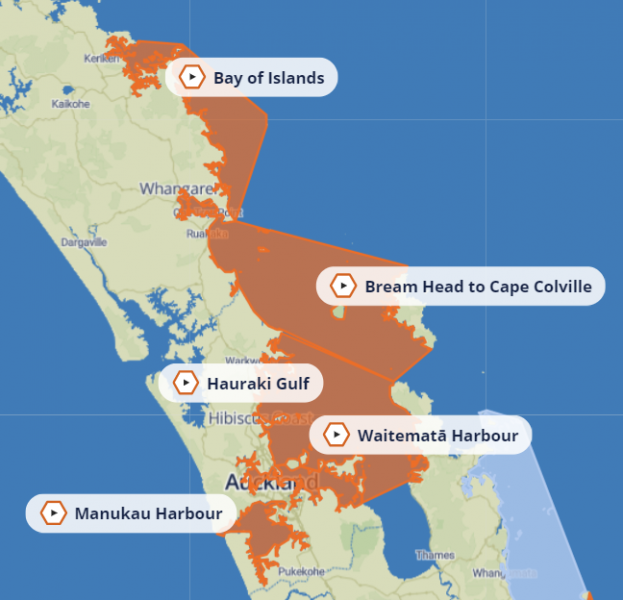 Figure 1: Bay of Islands and Auckland MetService recreational marine forecast areas
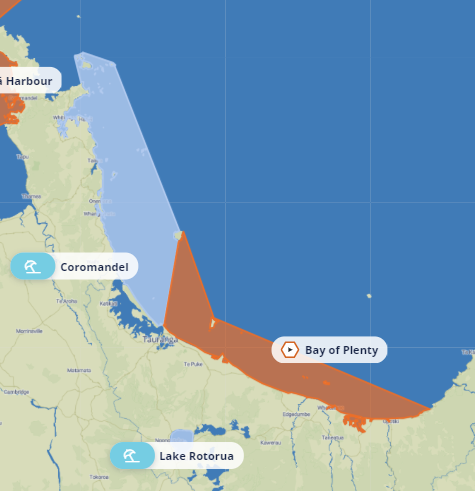 Figure 2: Coromandel and Bay of Plenty MetService recreational marine forecast areas
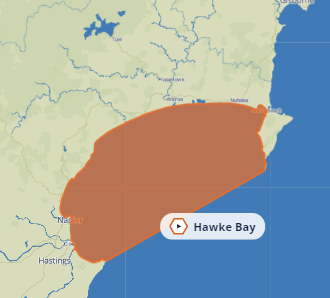 Figure 3: Hawke Bay MetService recreational marine forecast area
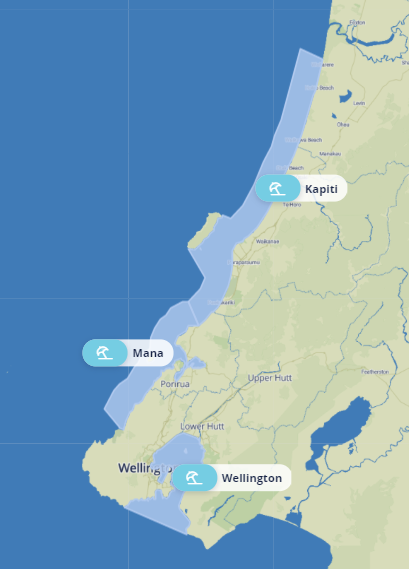 Figure 4: Kapiti, Mana and Wellington MetService recreational marine forecast areas
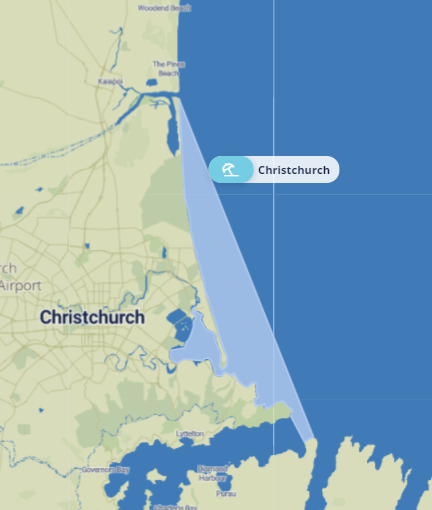 Figure 5: Christchurch MetService recreational marine forecast area
New Zealand’s mountainous terrain has a large influence on the wind flow – it can vary significantly around the next headland or in the lee of the next set of hills. The wind flow, in turn, affects the local sea conditions (see figure 6). For these and other reasons, recreational forecasts describe the average weather conditions expected within the area, and any significant changes expected to those conditions.
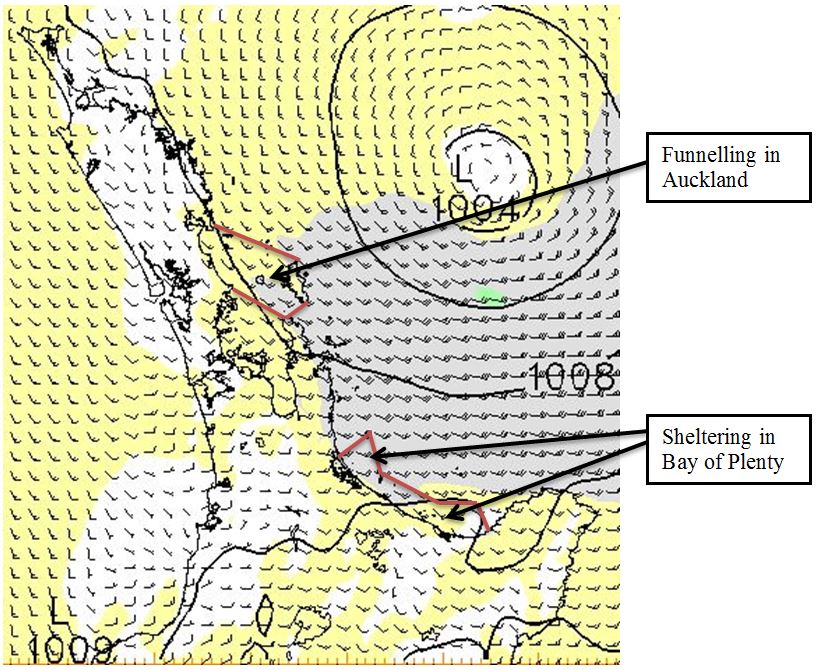 Figure 6: Example of MetService wind guidance showing different conditions within the same recreational marine area
Because they are broadcast on VHF radio, recreational forecasts have a restriction on allowable length: hence, the amount of detail that is possible. The forecaster will include additional detail, like notable variations expected across a recreational area, if space permits (see figure 7). Bay of Plenty Recreational Marine Forecast
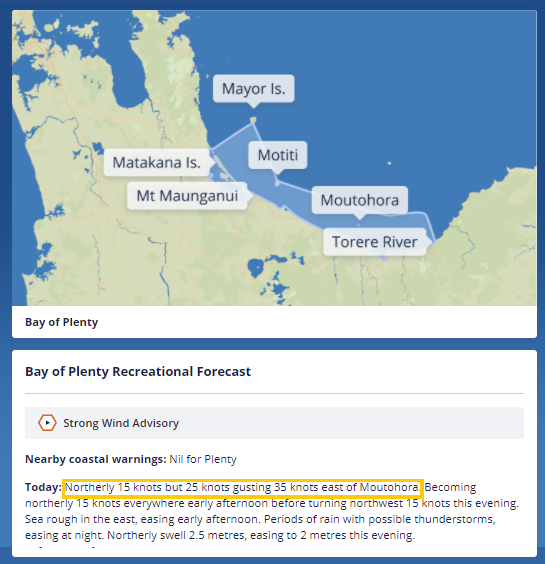 Figure 7. Example of Coromandel recreational marine forecast split into two areas (highlighted in yellow box).
Recreational forecast areas are much smaller than coastal forecast areas and the forecasts include a higher level of detail. Today and tomorrow are described in detail, followed by a brief outlook for the following 3 days.
What’s included in the recreational forecast
Situation
A situation statement is included on every Recreational Marine covering the New Zealand Coastal Situation.
Warning/Advisory
- Strong Wind Advisory: When mean wind speeds are expected to be between 25 knots and 33 knots.
- Squall Warning: When mean wind speeds are less than 34 knots but prolonged gusts of 34 knots or more are expected. These conditions can produce gusts exceeding 60 knots and are often associated with periods of strong thunderstorm activity.
- Gale Warning: When mean wind speeds are expected to be between 34 knots and 47 knots.
- Storm Warning: When mean wind speeds are expected to be greater than 47 knots.
Bay of Plenty Recreational Forecast
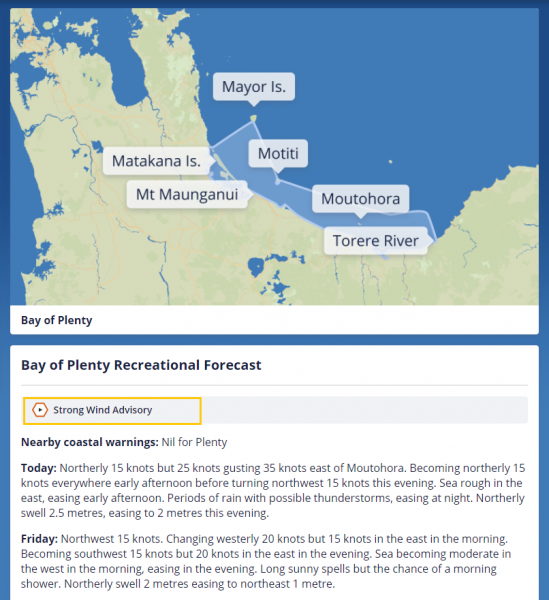 Figure 9: Example of the Wellington recreational marine forecast with a strong wind advisory in force
The recreational forecast will also include a statement indicating whether there is a gale or storm warning in force for the corresponding coastal area (see figure 9 above – underlined in yellow).
Wind
Winds are mean time-averaged wind speeds, as would be measured over 10 minutes and then averaged. Speed is in knots (kt) and forecast to the nearest 5 knots, and direction is defined as where the wind is coming from using eight compass points (N, NE, SW, etc). Changes of 5 knots or more in speed and 45 degrees or more in direction are included. Gusts expected of 50% or more higher than the mean speed and those 35 knots or greater will be mentioned in the forecast. Smaller scale local effects such as sea breezes are mentioned in recreational forecasts.
Sea state
What we call sea state is the effect that the local winds have on the sea conditions – this is independent of travelling swell waves generated by winds outside of the local area. For brevity, only the highest expected sea state through the forecast period is mentioned along with the trend (eg. easing, rising). Sea state is related to the Beaufort scale and describes the state of the sea surface rather than just the resulting wave heights, known as ‘wind waves’. The World Meteorological Organisation and MetService use the Douglas Sea Scale to define sea state. Figure 10 gives sea state as a function of wind speed, and figure 11 displays the relationship between the Beaufort scale and sea state.
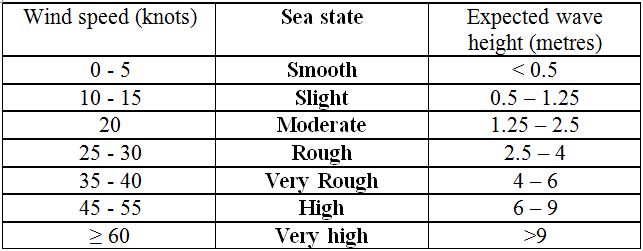 Figure 10: Sea state as a function of wind speed
Note that wind wave heights are significantly affected by local conditions, such as whether the wind is onshore or offshore.
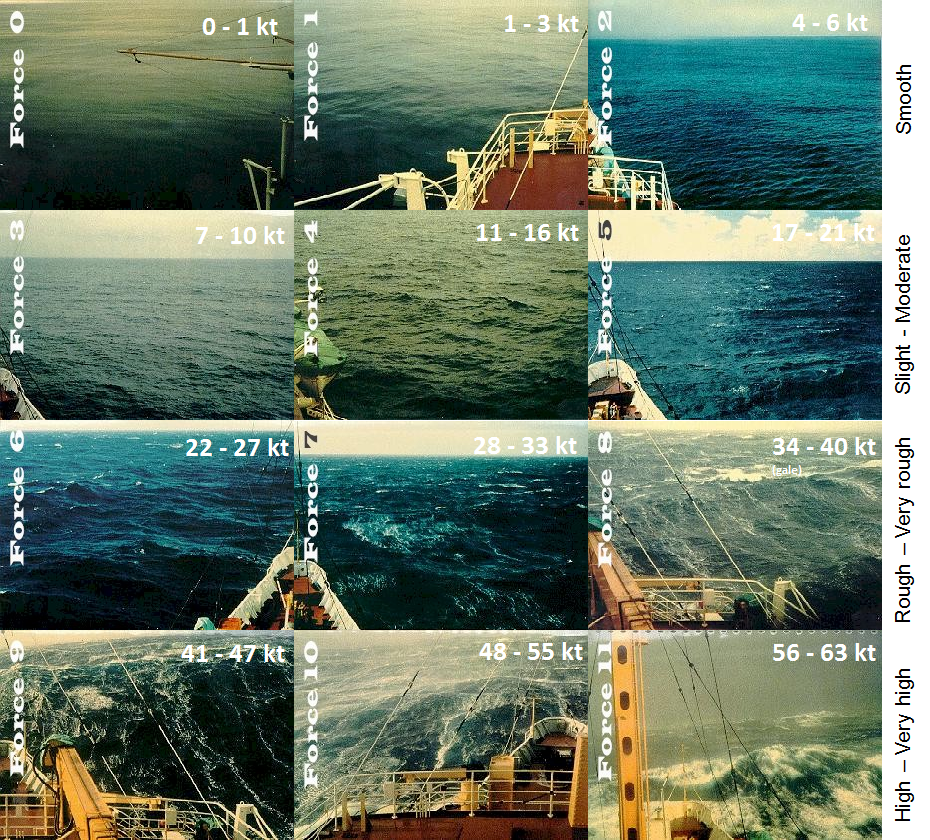 Figure 11: Relationship between the Beaufort scale and sea state. Image from http://en.wikipedia.org/wiki/Beaufort_scale
Swell
Swell refers to waves that develop over a longer time than locally-generated wind waves, and over a larger area. Swells waves (often called just swell) can travel long distances and usually originate hundreds or thousands of kilometres away from where they have an impact. Swell waves have longer periods (time between waves passing by) than wind waves and so affect crafts differently. Swell height can be described as:
- Significant swell height: the average peak-to-trough height of the highest one third of the waves. This is what you’d generally ‘eyeball’ the wave height to be.
- Occasional wave height: 50% higher than the significant wave height. This is generally the biggest wave of a group of waves.
- Maximum wave height: The highest reported wave height over a long duration (e.g. one day) and can be twice the significant wave height.
Recreational forecasts report the significant wave height, as well as the direction and any significant changes. These include changes of 45 degrees in direction or 0.5 metres in height. Two different swells can be forecast for the same area.
Visibility/weather
A brief description of the weather is included; however types of weather that reduce the visibility to fair or worse (eg. showers, rain, drizzle) take priority. Areas with a moderate or high risk of thunderstorms are also mentioned.
- Fair visibility: 2-5 nautical miles (4-9 km)
- Poor visibility: 0.5-2 nm (1–4 km)
- Very poor visibility: Less than 0.5nm (1km)
Visibility isn’t mentioned with fog as by definition the visibility is less than 0.5 nm (1 km) in fog.
Bay of Plenty Recreational Marine Forecast
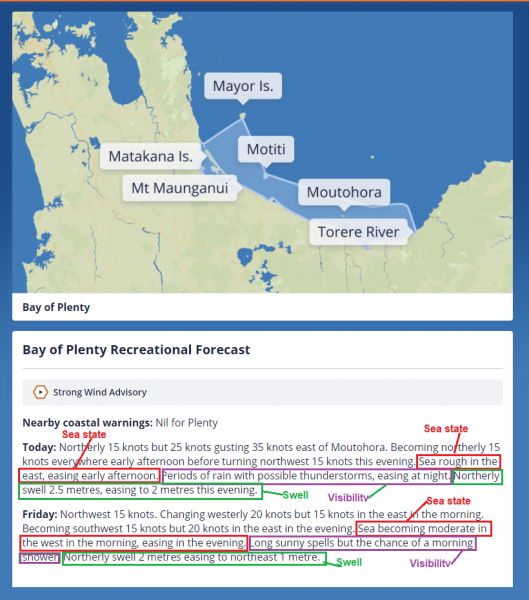 Figure 12: Example of Bay of Plenty recreational forecast sea state, swell and weather
Timing
We have clearly defined timings for our marine forecasts; however, the times can be lengthened by using more generic terms like morning, afternoon and evening. This may also be appropriate for gradual changes or where there is uncertainty in the timing.
 Figure 13: MetService timings
These timings are very similar to those used in public forecasts.
High tides
High tides are included with the recreational forecasts. They are automatically generated using standard tide data from Land Information New Zealand and include the height and the time of occurrence.
Christchurch Recreational Marine Forecast
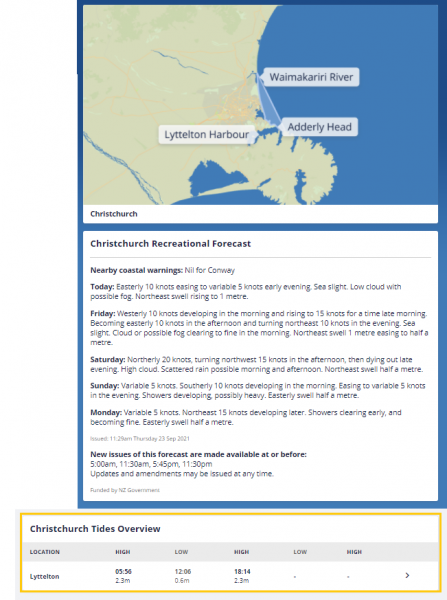 Figure 14: Example of Christchurch recreational marine forecast high tides
For Lake Taupo and Lake Rotorua, swells are not mentioned as the distances over which the winds blow (the fetch) are too small for true swells to develop. Tides are also not applicable.
Lake Taupo Recreational Forecast
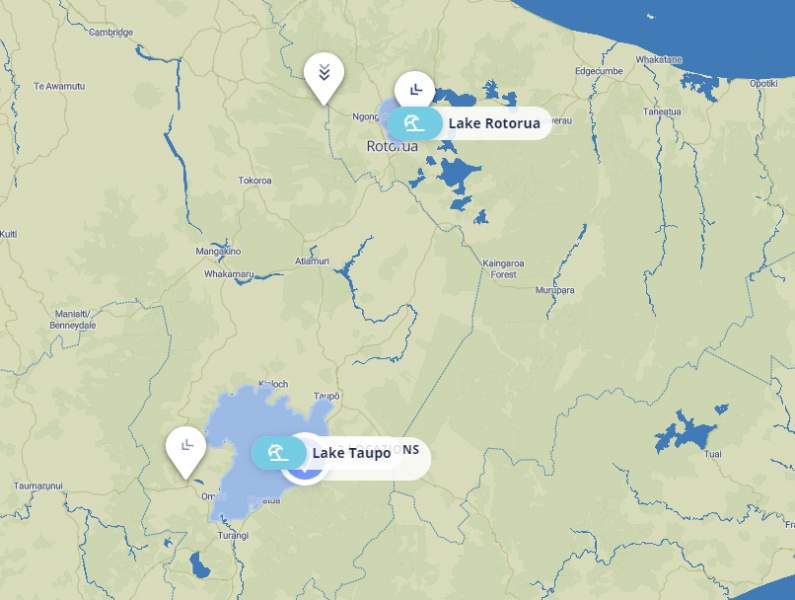 Figure 15: Lake Rotorua and Lake Taupo forecast areas