Written by John Law, Meteorologist
On 23 March each year, national weather services around the world celebrate World Meteorological Day to commemorate the establishment of the World Meteorological Organization on this day in 1950. In 2014, the theme for World Meteorological Day is 'Weather and Climate: Engaging Youth'. We thought this was an ideal opportunity to provide a few do-it-yourself weather projects for the keen weather kids out there.
Why do we need weather observations?
Before weather forecasters can tell us what the weather is going to be doing tomorrow, they need to know what it is doing right now.
Every hour hundreds of weather stations across New Zealand, from Cape Reinga to Stewart Island, send in reports of how the weather is where they are. As well as telling us how windy it is, how warm it is and how much rain has fallen, the weather stations can also tell us where it is raining or snowing, how much cloud there is, and the pressure of the air.
These weather reports are really important to weather forecasters who use them along with information from radars and satellites to find out what the weather is doing across the country. These observations are also shared around the world to help build a global picture of the current conditions. Not all of us have an official weather station in our back garden or can afford to build our very own weather radar - but that doesn’t mean we can’t take our own measurements using things we find around the house.
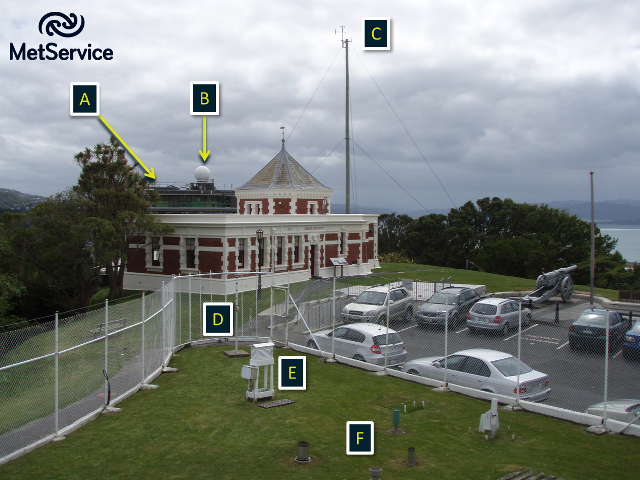 This is looking north and showing the weather station in Wellington’s Botanical gardens. A is the MetService headquarters behind the brick building; B is a receiver on the roof which lets us collect information from satellites as they pass overhead; C is an anemometer which is used to measure wind speeds; D is a device that measures sunshine; E is the Stevenson Screen used to keep our thermometers in the shade; and F is a collection of different rain gauges.
Wind
Although we cannot see wind we can see the effects that it has on other things like trees , flags and smoke. The Beaufort scale compares wind speeds with the effects that they have over land and sea. For example, if we notice that only the leaves of a tree are moving in the wind we would describe it as a “light breeze”, but if we noticed that the whole tree was shaking we would call it a “gale”.
You can find out more about the Beaufort scale and download your own copy here: http://about.metservice.com/assets/downloads/learning/winds_poster_web.pdf
Rain
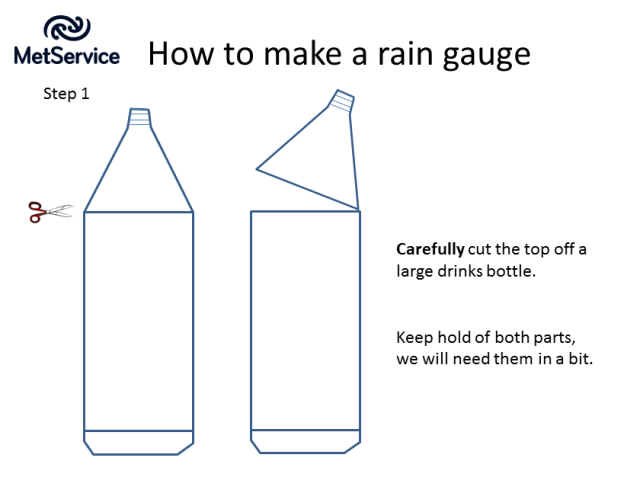
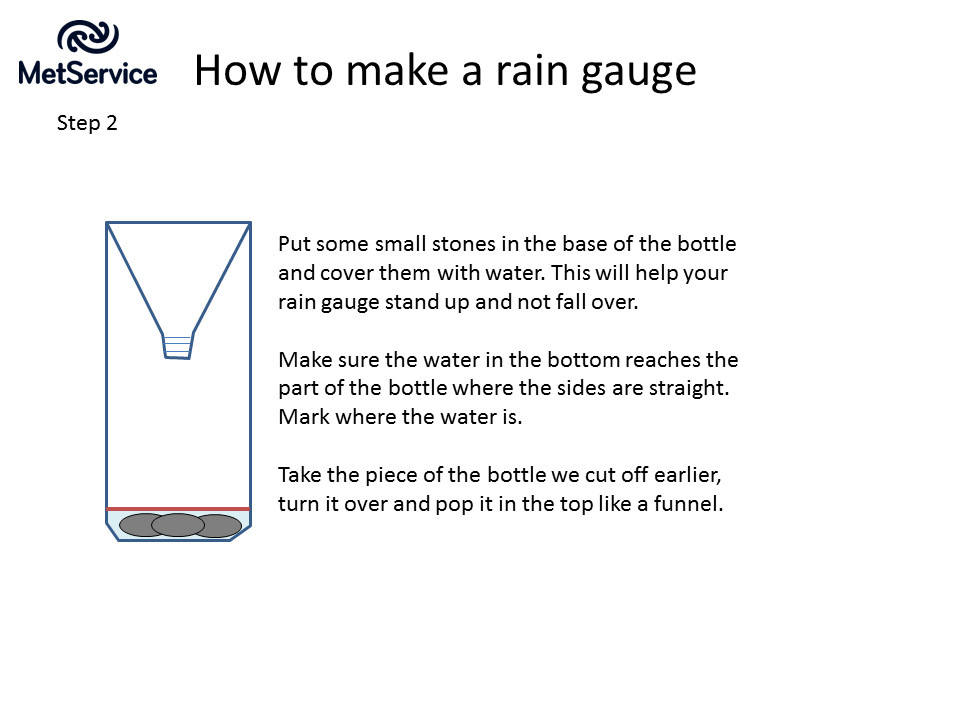
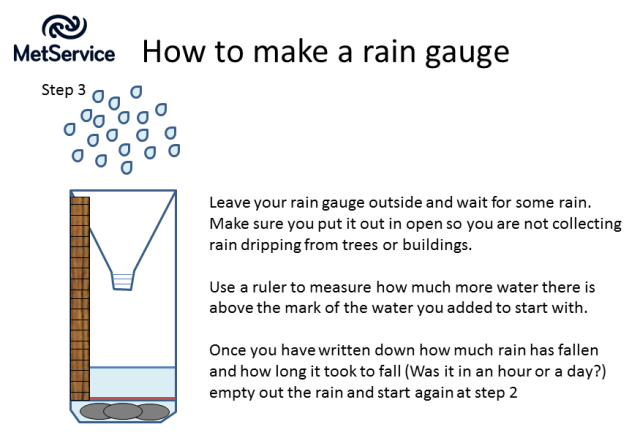
Measuring how much rain has fallen needs a rain gauge. We can make a simple rain gauge by using a straight sided bottle, some stones and a ruler:
 The rain gauges that MetService use are called tipping bucket rain gauges. As rain falls into the gauge it fills a little bucket at the base of a tube, then once the bucket is full it tips over and empties out the rain it has collected. A counter keeps track of how many times the bucket tips over and as we know how much rain can fit in the bucket we can work out how much rain has fallen. Because the rain gauge empties itself it never overflows.
Temperature
The temperature of the air can very a lot over a short distance. To measure the temperature of the air, meteorologists [scientists who study the atmosphere] use thermometers. You might already have a thermometer in your house which will let you measure the temperature.
The thermometers that are used for the official observations are kept in special boxes called Stevenson screens. These white boxes keep the thermometers shaded while the gaps on either side of the box let the air move freely over the thermometer.
Because we share this information around the world, it is important that we are measuring the temperature in the same way as the meteorologists everywhere else in the world. This is also why we have a special calibration lab, to ensure all our measuring equipment performs exactly the same way as the equipment used by other national weather services.
Weather
There are lots of different types of weather, so as well as recording things like if it is raining or snowing, observations such as if you can hear a thunderstorm or it is foggy are useful things to note down.
Why not keep track of the different types of weather you can observe over a week? You can write them down or draw a picture to show the weather.
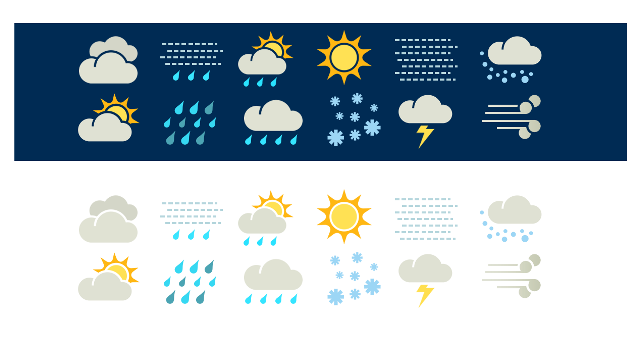
These are the symbols we use on our website to show the different types of weather - can you name them all?
Clouds
As well as different types of weather there are different types of cloud. Some are high in the atmosphere and made of ice others are low down close to the ground made of large water droplets giving the underside of the cloud a menacing grey colour. We have some great clouds in New Zealand, and this poster gives some great examples of the ones you might see: https://about.metservice.com/our-company/learning-centre/poster-downloads/
While you are looking at the different clouds outside, try to figure out how much of the sky is covered in cloud. Is it completely covered? Perhaps it is only half the sky that has cloud covering it or perhaps you can’t see any clouds at all.
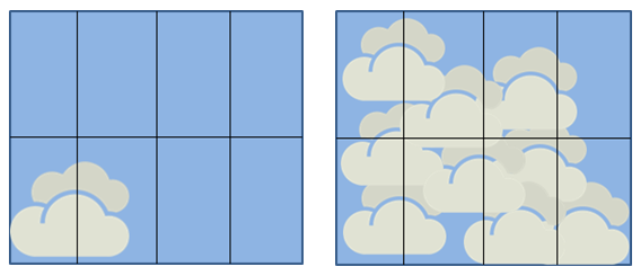
Weather observers measure the cloud cover in Oktas, or eights. A sky that is completely covered in cloud is called overcast and has 8 oktas of cloud.
How much of the sky do you think is covered in these pictures? Imagine squashing the cloud together and counting the grey coloured squares.
 How much cloud do you think there is in the picture of the weather station at the top of the page?
Weather codes
As you can imagine, sending all the weather information back to the weather office and sharing it takes a lot of computer power. To make it easier, all the information is transmitted as a series of codes.
Here’s an example of an observation that gets sent from a weather station:
93110 17698 /2311 10206 20137 40238 57006 60004 70300=
At first it looks like a random string of numbers, but each group gives information about different aspects of the weather. The first block gives the station number for Auckland so we know where the observation comes from. The other blocks give information about wind speed, temperature rainfall and weather. From this observation we know that there is 11 knots of wind coming from the southwest; the temperature is 20.6°C; the surface pressure is 1023.8hPa; there hasn’t been any rainfall in 24 hours; and there is some cloud developing.
You can find more about decoding the observations here: http://kestrel.nmt.edu/~zeljka/downloadfiles/st589/synopLegend.pdf
We hope you enjoy doing some or all of these weather projects!