During October 2014, MetService Meteorologist John Law spent five days in Antarctica. We thought you would be interested to see Antarctica through John's eyes, so he kept a blog to report back on what he was up to each day!
"For the next week I will be getting taste of what it is like to live and work in one of the most hostile environments in the world; Antarctica. As the coldest, windiest and driest continent on the globe Antarctica is a land of extremes and provides a unique opportunity for scientists from across the globe to work together. The Antarctic treaty, signed in 1959, ensures that to this day the continent is bound by the overarching principles of peace and science."
Sunday 20th October 2014 - Cape Evans
After almost two days holed up in the base while winds and snow lashed the area, it was a great sight to see the weather had improved for Sunday, just in time for a base trip to Cape Evans. Cape Evans is around 30km to the northwest of Scott base and is the site of Captain Scott’s hut from the Terra Nova expedition of 1910-1912. The hut was home to Scott and his team before heading southwards to the pole.
The journey to Cape Evans from Scott Base today takes around two hours traveling across the sea ice. The Terra Nova crew used to travel regularly from Cape Evans to Hut Point, where Scott Base is now, using a sled pulled by a team of dogs. In comparison, our journey in the back of one of Antarctica New Zealand’s heated Hagglund vehicles was luxury.
 Travel across the Ice Shelf was much more comfortable than in Scott’s day but the scenery no less spectacular.
The annual change in sea ice around Antarctica is the one of the largest natural changes that takes place. At the peak of the season the sea ice can cover an area of almost 20 million km2, while at the end of the summer the figure is reduced to around 4 million km2.
Compared to icebergs and the ice shelf, the thickness of the sea ice is much thinner - usually only a few metres.
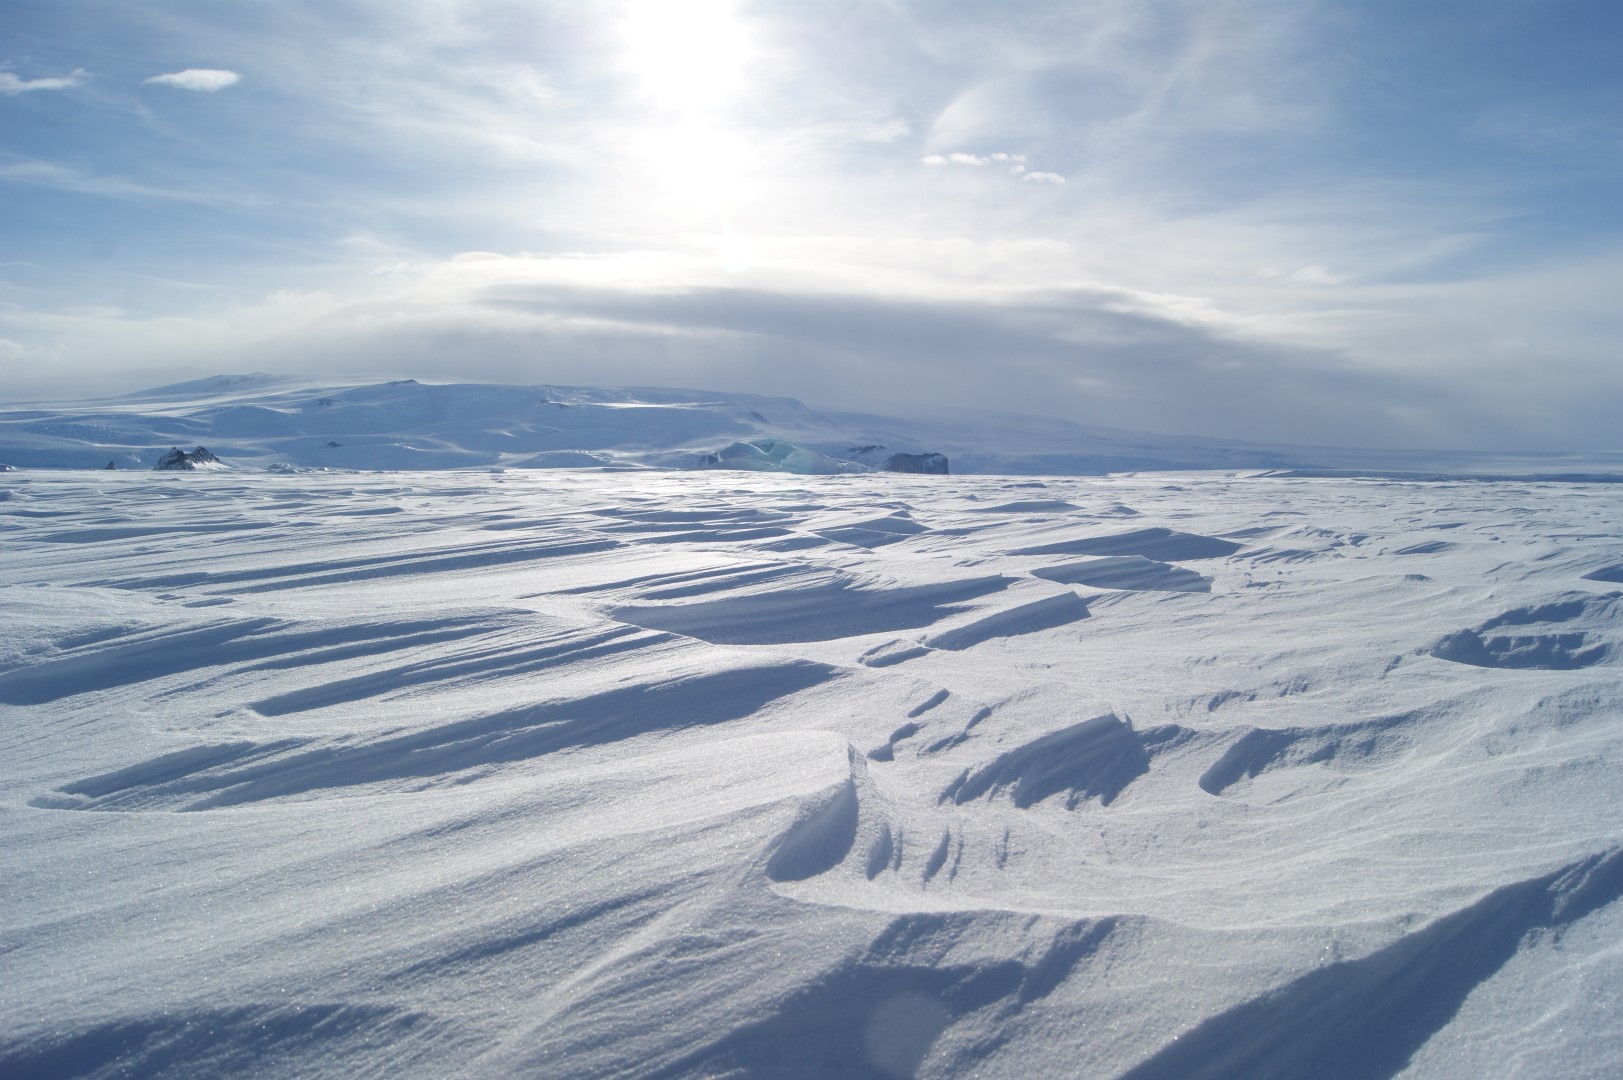 The view from the sea ice on McMurdo Sound back towards Ross Island. The features in the foreground are piles of hardened, wind-shaped snow called sastrugi.
As we traveled across the ice we took extra care to ensure it was thick enough to support the weight of the vehicle (although I am assured that the Hagglund is amphibious and will float, I am not keen to test it just yet). When we approached a crack in the sea ice, we checked to see what kind of crack it is and if there was enough ice to support our weight.
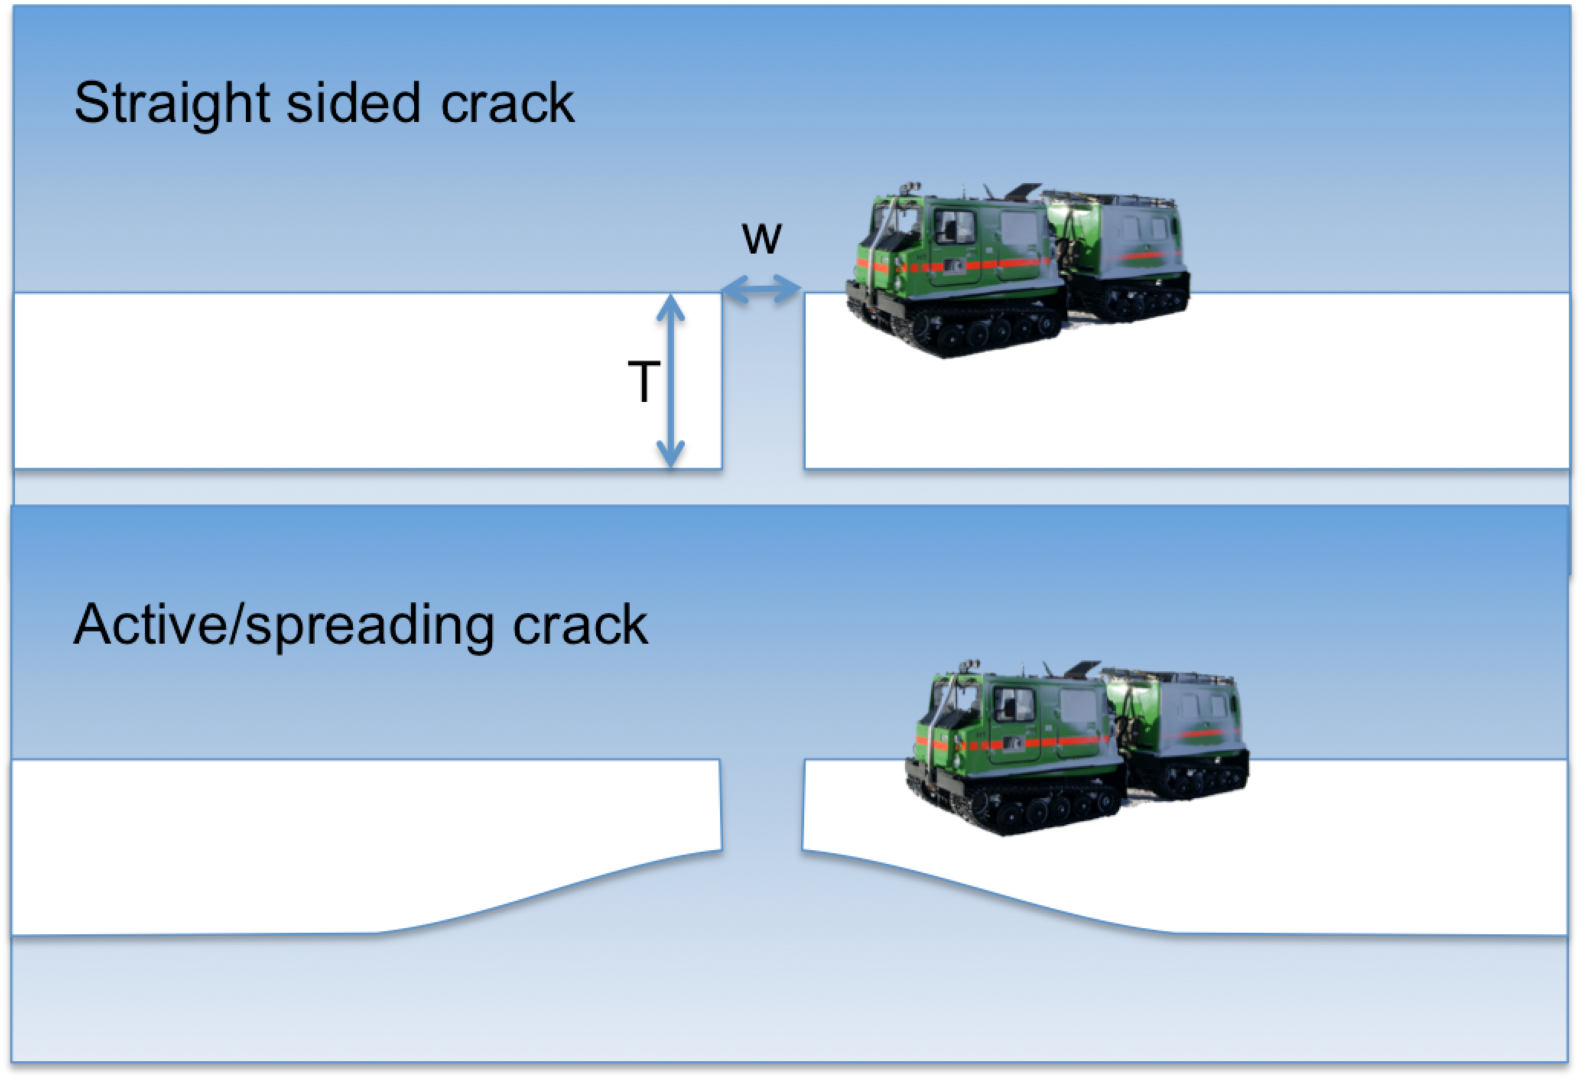 The Hagglund needs a sea ice thickness (T) of 75cm to work safely; the maximum width of a crack (W) is 70cm. With an active crack, a drill is used to measure the thickness of the sea ice.
When we measured across the crack it was not strong enough, so we used bridging timbers to safely get across. Once on the other side of the crack it was on to Cape Evans!
Cape Evans
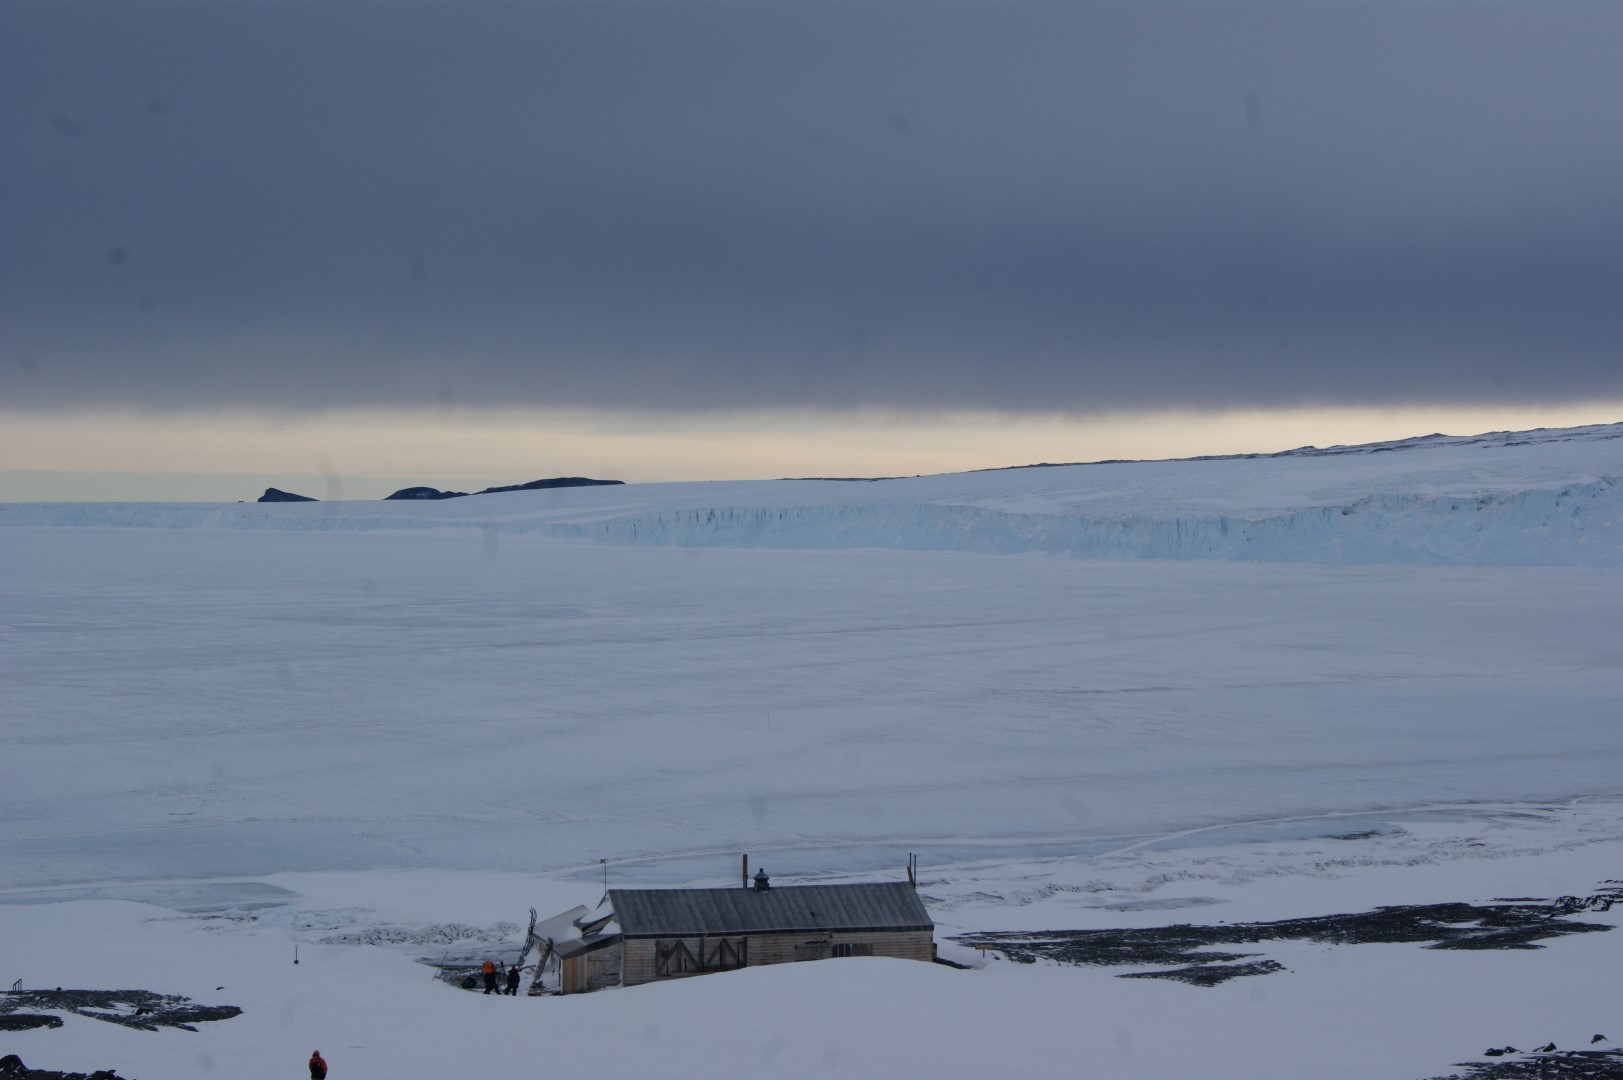
The hut at Cape Evans remains in a state of impeccable preservation, thanks in part to the dry, cold conditions of the Antarctic, but also to the hard work of the Antarctic Heritage Trust who have help maintain and conserve several huts on Ross Island.
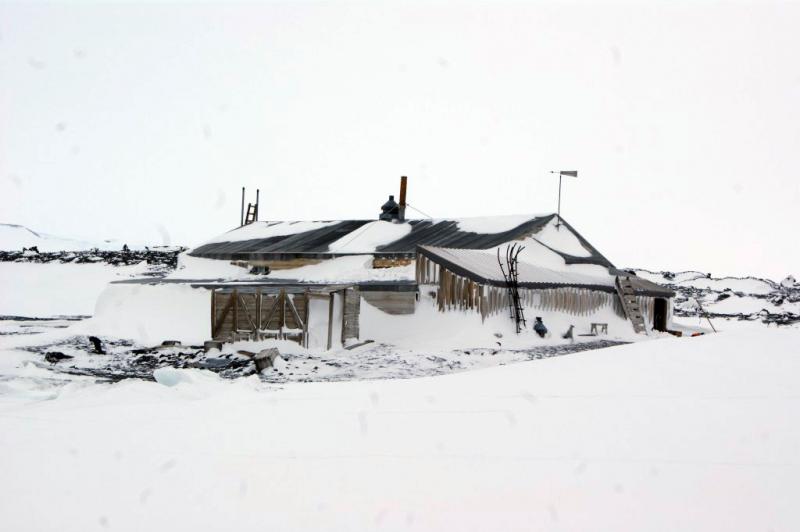 Scott’s hut at Cape Evans. The front door is on the right and above the front door is the wind vane, one of the meteorological instruments the team brought with them.
The weather was even more vital to the early explorers of Antarctica than it is to its current inhabitants. Measurements were made frequently to keep up to date with the latest changes and to start a long history of meteorological observations from Ross Island. For the 1910 expedition the meteorologist was George Simpson, also know as “Sunny Jim”. Simpson had worked for the UK Meteorological Office as well as the Indian Meteorological Service before heading to Antarctica. Simpson went on to become head of the UK Meteorological Office.
In his diary Edward Wilson, gives more information about the measurements that Simpson made each day. As well as the wind vane in the hut porch which continuously recorded the wind direction on a drum there was a thermometer and barometer at the back of the corner of the hut which Simpson could use to check outside conditions without leaving the hut.
On a small hill outside, were further instruments including a sunshine recorder, a Stevenson screen housing more thermometers and some anemometers after which the hill got its name – Wind Vane Hill. Simpson and team also took 4 hourly observations of clouds and the direction of Erebus’ smoke to give information about wind speed and direction at higher levels in the atmosphere. Inside the hut, Simpsons observation corner is still easily recognizable from the photos of him at work.
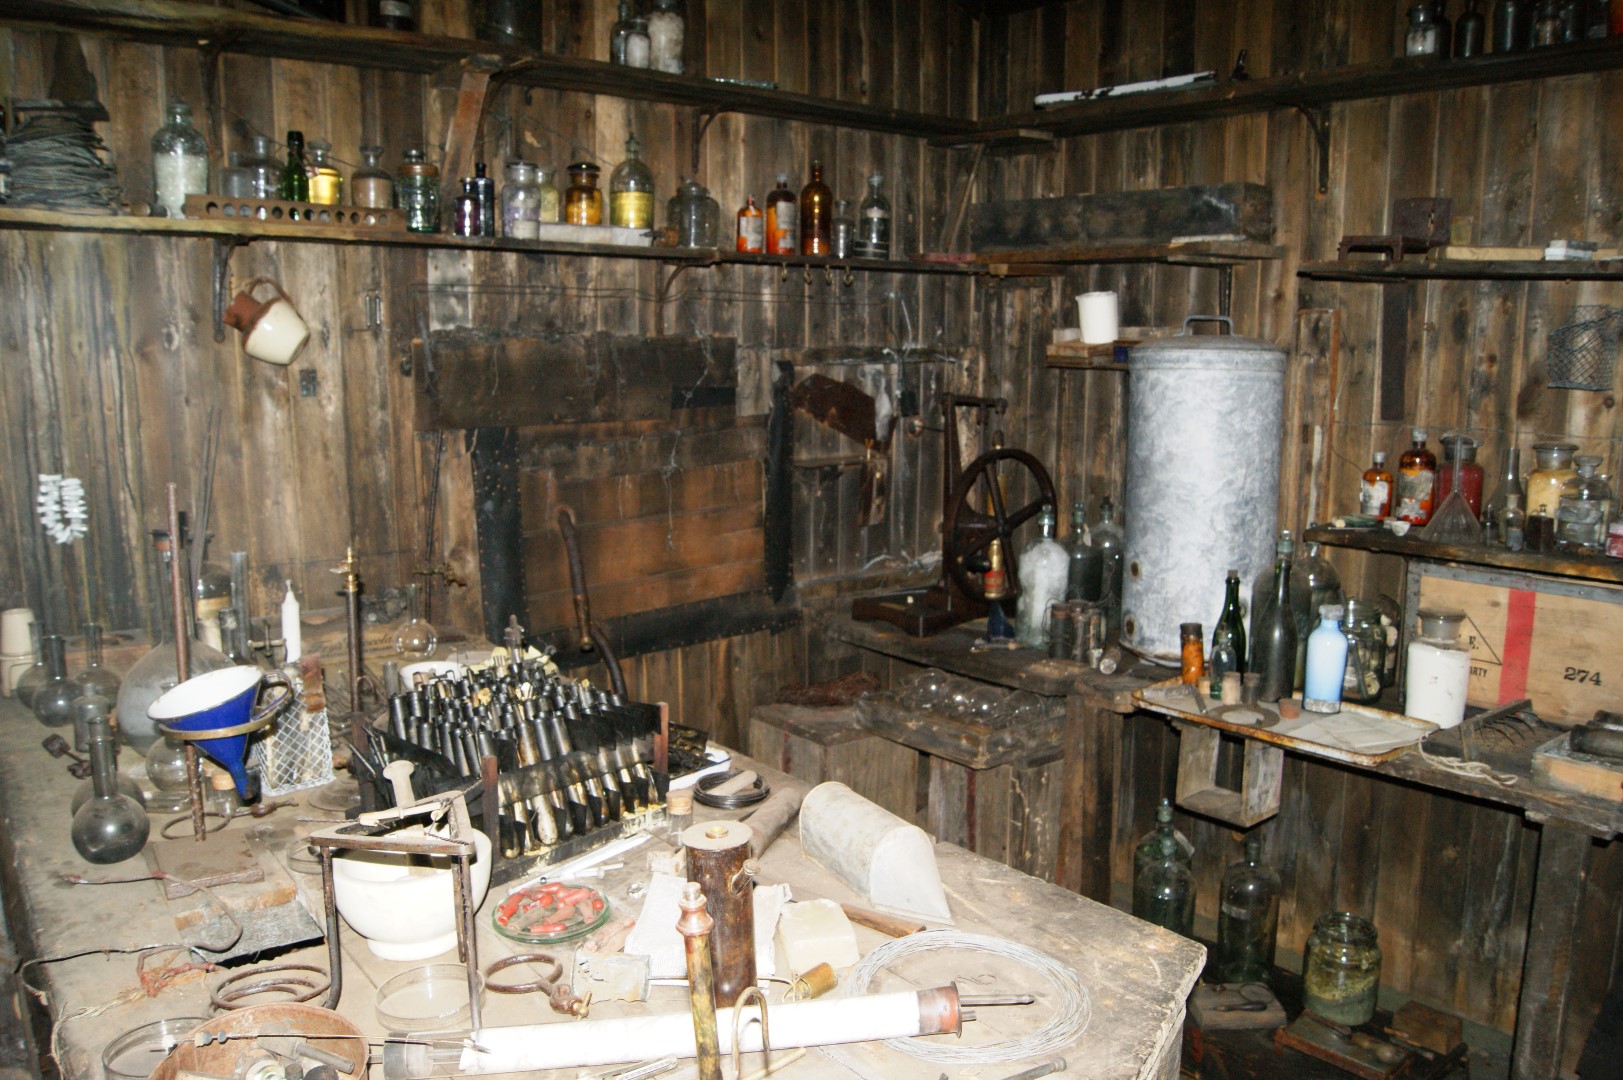 The metal tubes on the wall at the back of the hut were attached to a Dynes pressure anemometer – also referred to as a “blizzardometer” - and the men would have to go outside regularly and clean the tubes of snow. Other meteorological equipment needed careful looking after in the cold weather.
The sunshine recorder (which was like the one still in use until 2020 on top of MetService headquarters) was prone to frosting up and would need to be de-iced in order to work. T.G.Taylor, the senior geologist of the expedition, said working on the sunshine recorder was "extremely disagreeable".
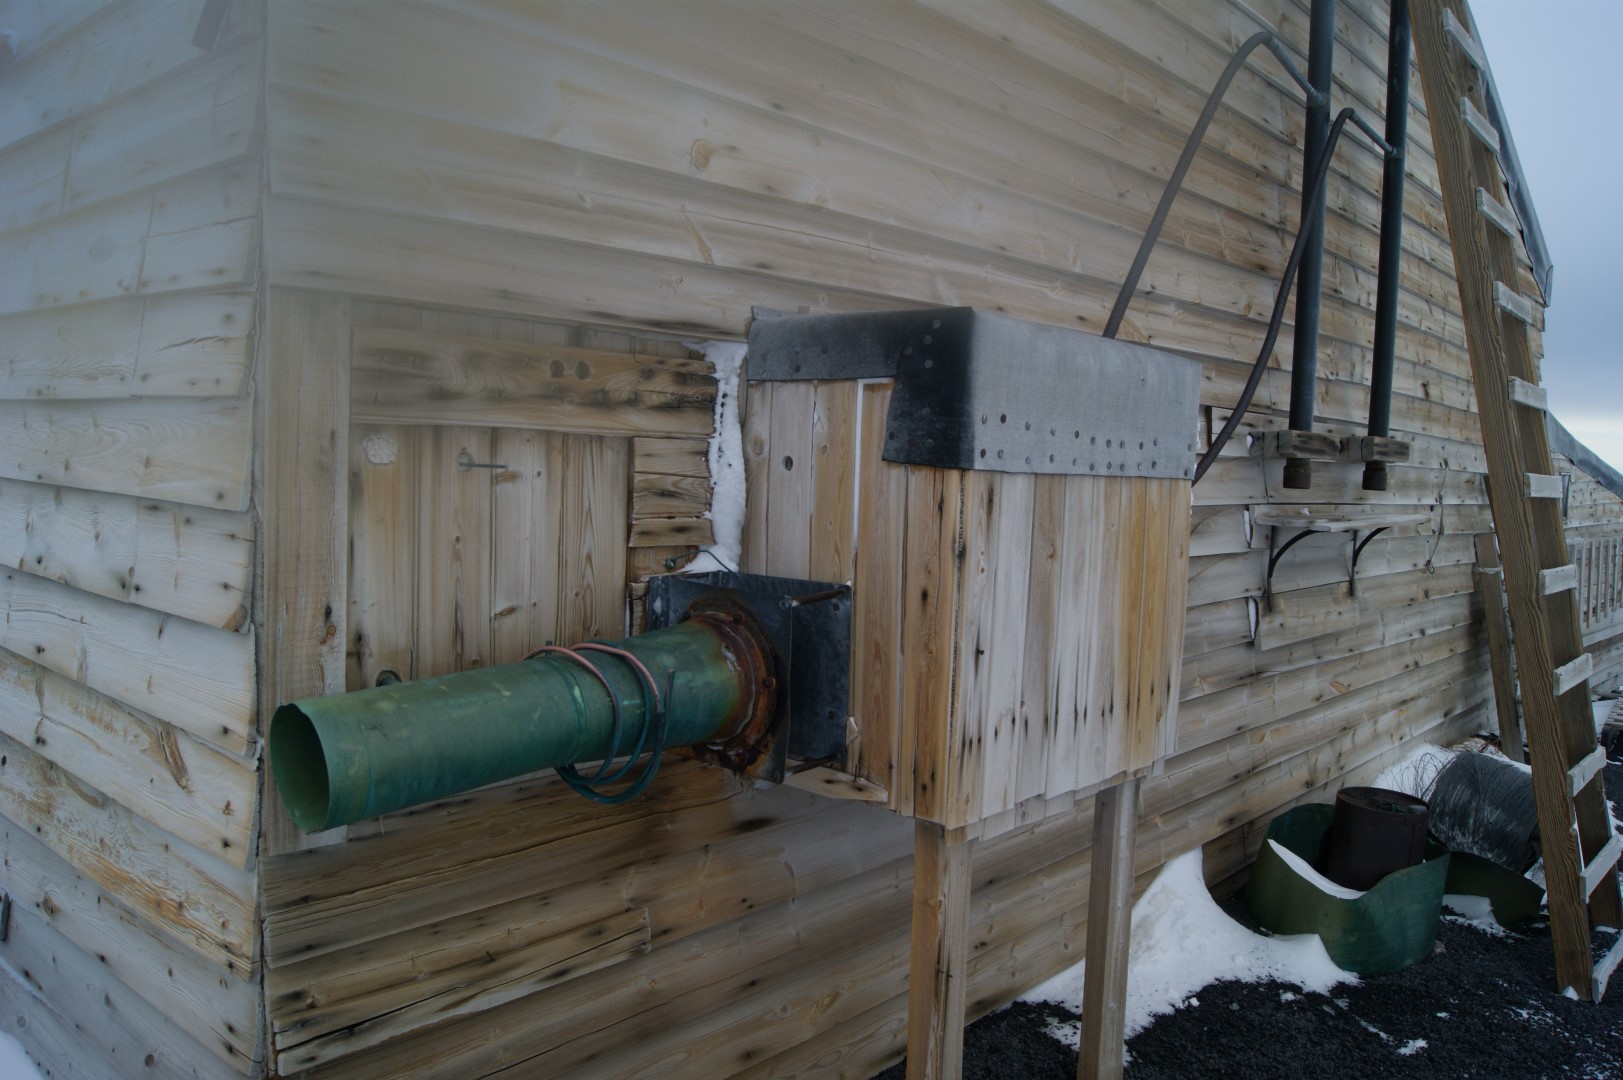 Outside at the back of the hut, the metal tube and wooden housing held thermometers and barometers that could be read inside without braving the elements - but not all the observations could be made from the relative warmth of the hut.
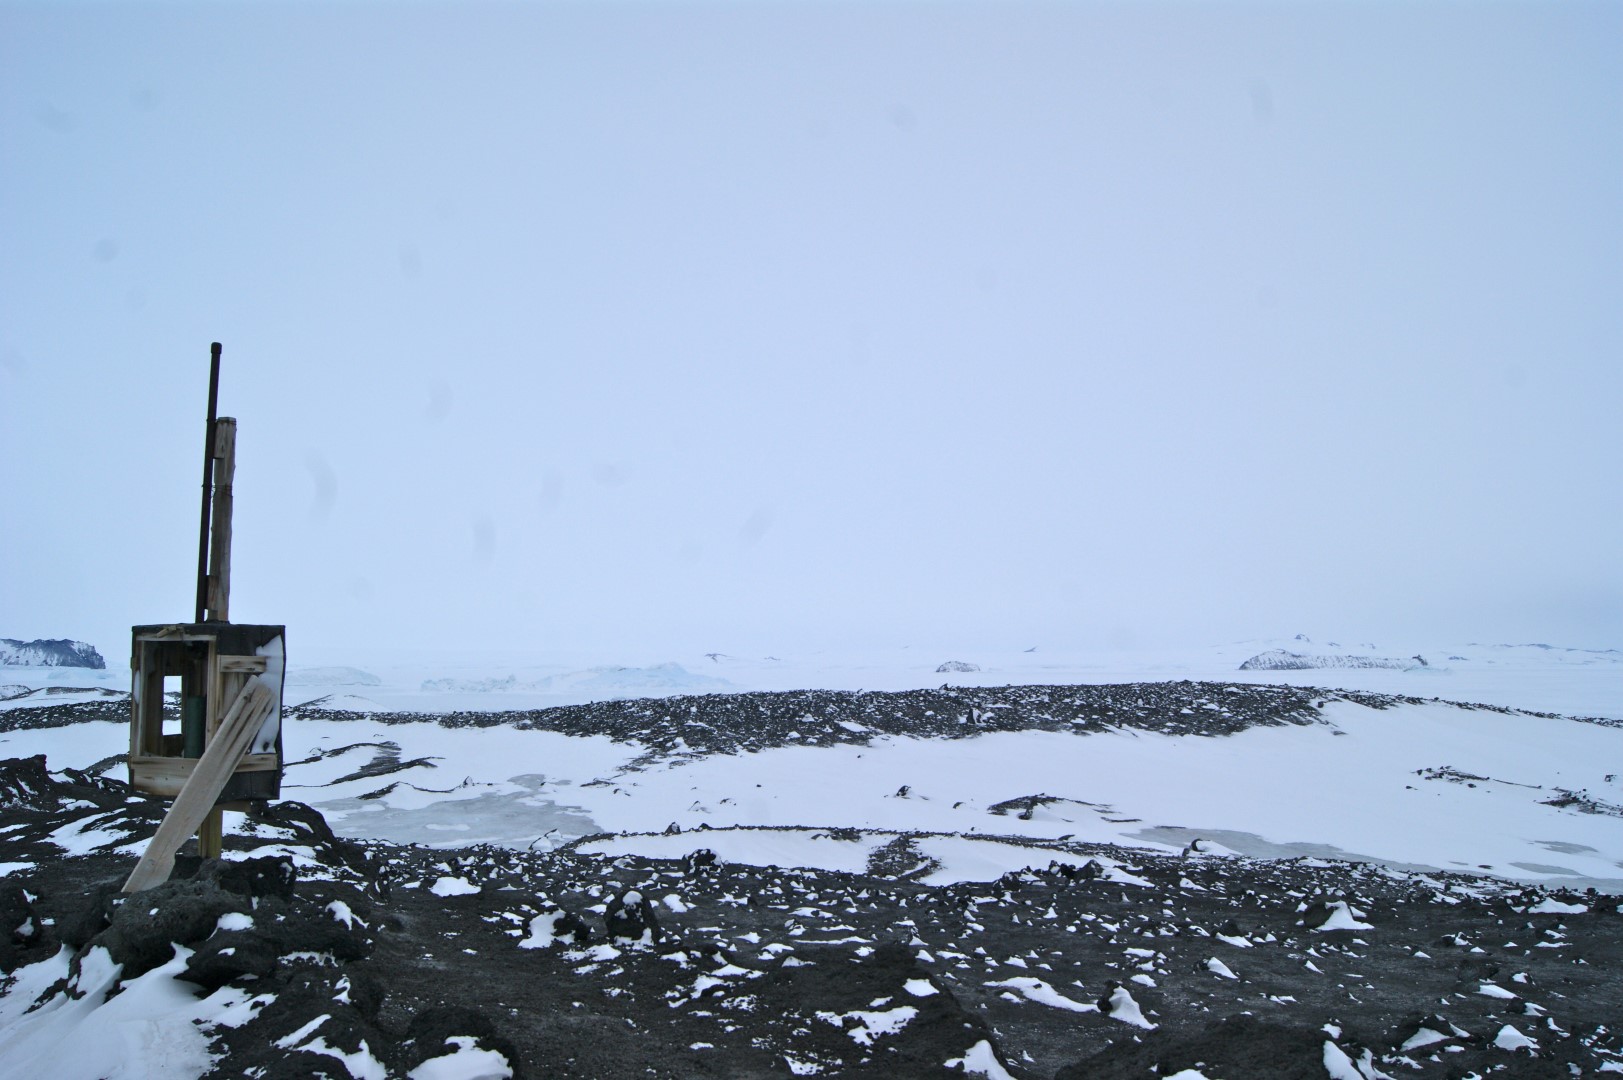
 The snow-caked remains of one of the original Stevenson screens at the base of Wind Vane Hill that would have contained thermometers for regular temperature readings. Further up the hill are the remains of one of the early anemometers.
Compare what it looks like today with this image of Dr Simpson taking observations on Vane Hill.
Although these observation stations are not far from the hut, one observer spent six hours trying to find their way back after getting lost in poor visibility. However, on a good day the view from the top of the hill is stunning.
 The hut gives a real glimpse of life in the early days of Antarctic travel. It is an awesome experience and stepping inside the pinnacle of a boyhood dream.
To find out more about the Cape Evans hut head along to the Antarctic heritage trust website: https://nzaht.org/conserve/explorer-bases/scotts-hut-cape-evans/#gallery or check out the virtual tour on Google Street View: https://www.google.com/maps/views/view/streetview/antarctica/scotts-hut-cape-evans-on-ross-island?gl=us&heading=32&pitch=86&fovy=75
 We were also very fortunate to get a chance to meet some of the locals on the trip - a flock of penguins waddled and slid their way across the sea ice to come and say hello. The drive back through McMurdo Sound showed how different the meteorological station is now.
Here is the current McMurdo Meteorological weather centre, more commonly known as MacWeather. It's normally easy to spot the weather station; it is the one with the aerials, radomes and weather stations on the roof.

Saturday 18th October Scott Base and Arrival Heights
It was a windy start to the day with the base still under a condition one weather warning throughout the morning. Antarctica is the windiest continent on the globe. Sir Douglas Mawson of the Australian Antarctic Expedition once recorded a mean monthly wind speed of 35ms-1 when staying at Cape Denison.
“The climate proved to be little more than one continuous blizzard the year round; a hurricane of wind roaring for weeks together,” Mawson wrote in his account of the expedition, tellingly called “The home of the blizzard”
Why is it so windy? To understand the weather in Antarctica we need to look at how the continent fits into the global circulation pattern. The warming of the air over the equator leads to a zone of rising air. As this air rises it begins to cool as it heads polewards at higher levels of the atmosphere. Eventually this air cools and sinks back towards the surface.
Beneath the column of rising air the surface pressure is low while beneath the sinking area the pressure is higher and so a return flow of air along the surface from high to low develops. A series of these circulation systems between the equator and the pole results in a large amount of descending air over the poles and a persistent area of high pressure.
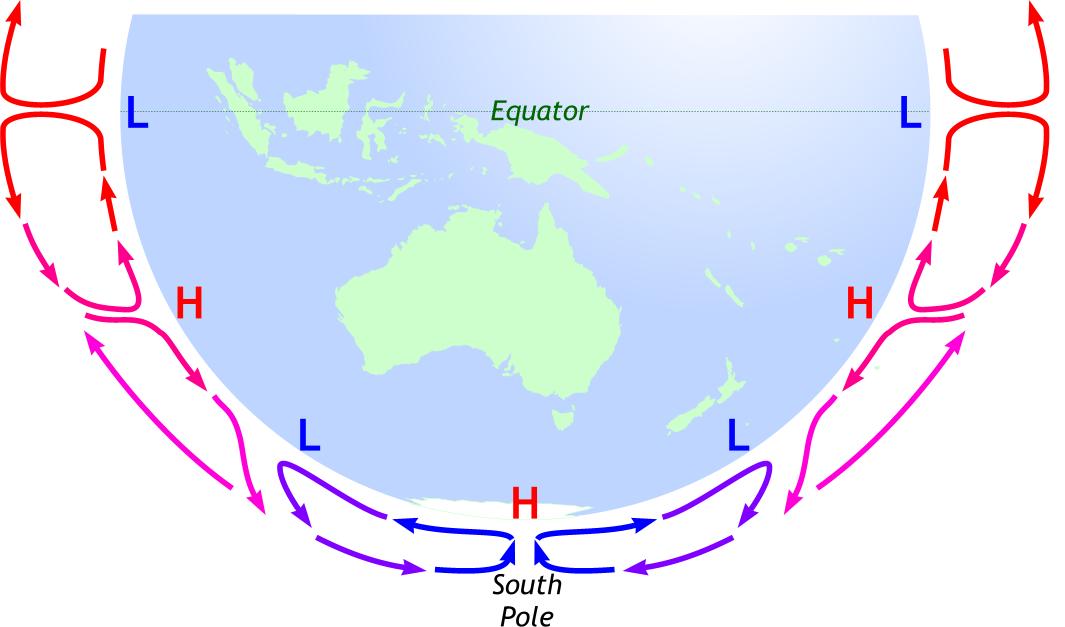 The circulation of air from the equator to the poles take the form of a series of circulation cells of rising and descending air.
The shape of Antarctica is a little like that of an upturned bowl. As air sinks down towards the surface it comes in contact with the cold, icy surface and cools further still. As the air cools its density increases, leading to an acceleration of the wind as it rushes down the slopes. These fast moving zones of dense air are know as katabatic winds and, when channeled by the complex terrain of Antarctica, can lead to rivers of winds, much like Mawson’s party experienced when they camped at Cape Denison.
 Katabatic winds are also a regular occurrence over the Ross Sea, at the six oclock position in the image. Image source Parish, T. R., and D. H. Bromwich, 2007: Reexamination of the Surface Airflow over the Antarctic Continent and Implications on Atmospheric Circulations at High Southern Latitudes. Mon. Wea. Rev., 135, pp. 1961-1973.
At Scott Base the high ground to the north of the base has a large influence on the local winds. Winds rushing over the ice shelf from the south are deflected back towards Scott Base by the high ground running west to east across the island, including the mountains Erebus and Terror.
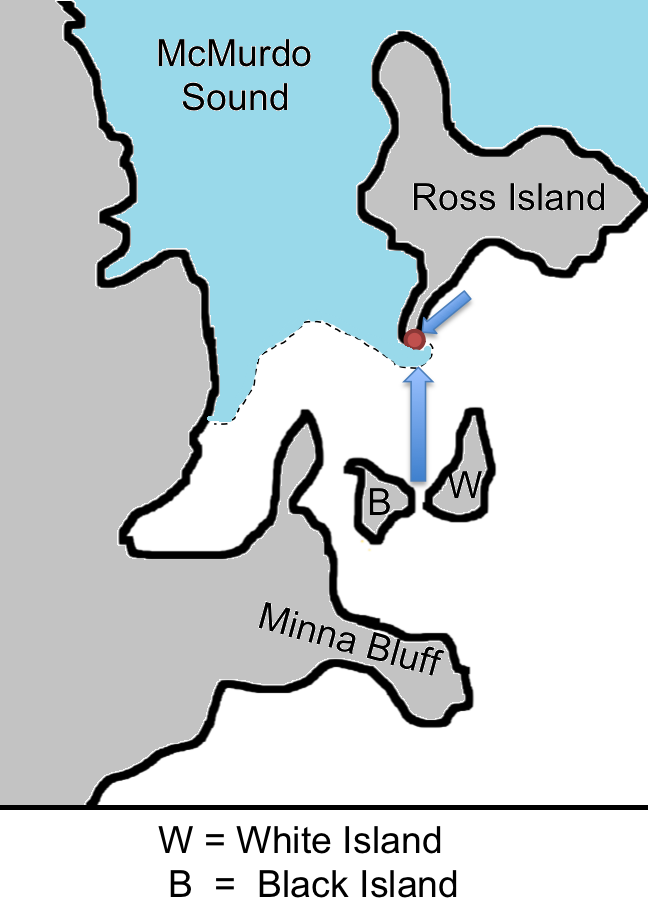 The predominant wind direction of a northeasterly for the base (marked as a red dot on the map).
However the strongest katabatic winds, like the ones we have seen today, are when the wind arrives from almost a straight southerly direction right over Minna Bluff and between White and Black Island. Being steeper, the rocks on Black Island make it harder for snow to settle on its surface while the lower topography means White Island keeps a coating of snow. Adapted from Observations of Ross Island by M.R.Sinclair
Arrival Heights
A brief break in the weather meant that we could head back outside, after a base-wide operation to clean the blocked snow from around the doors and stairs. I headed off base with the science technicians and Dan Smale, a scientist at NIWA, to the Antarctica New Zealand facility at Arrival Heights.
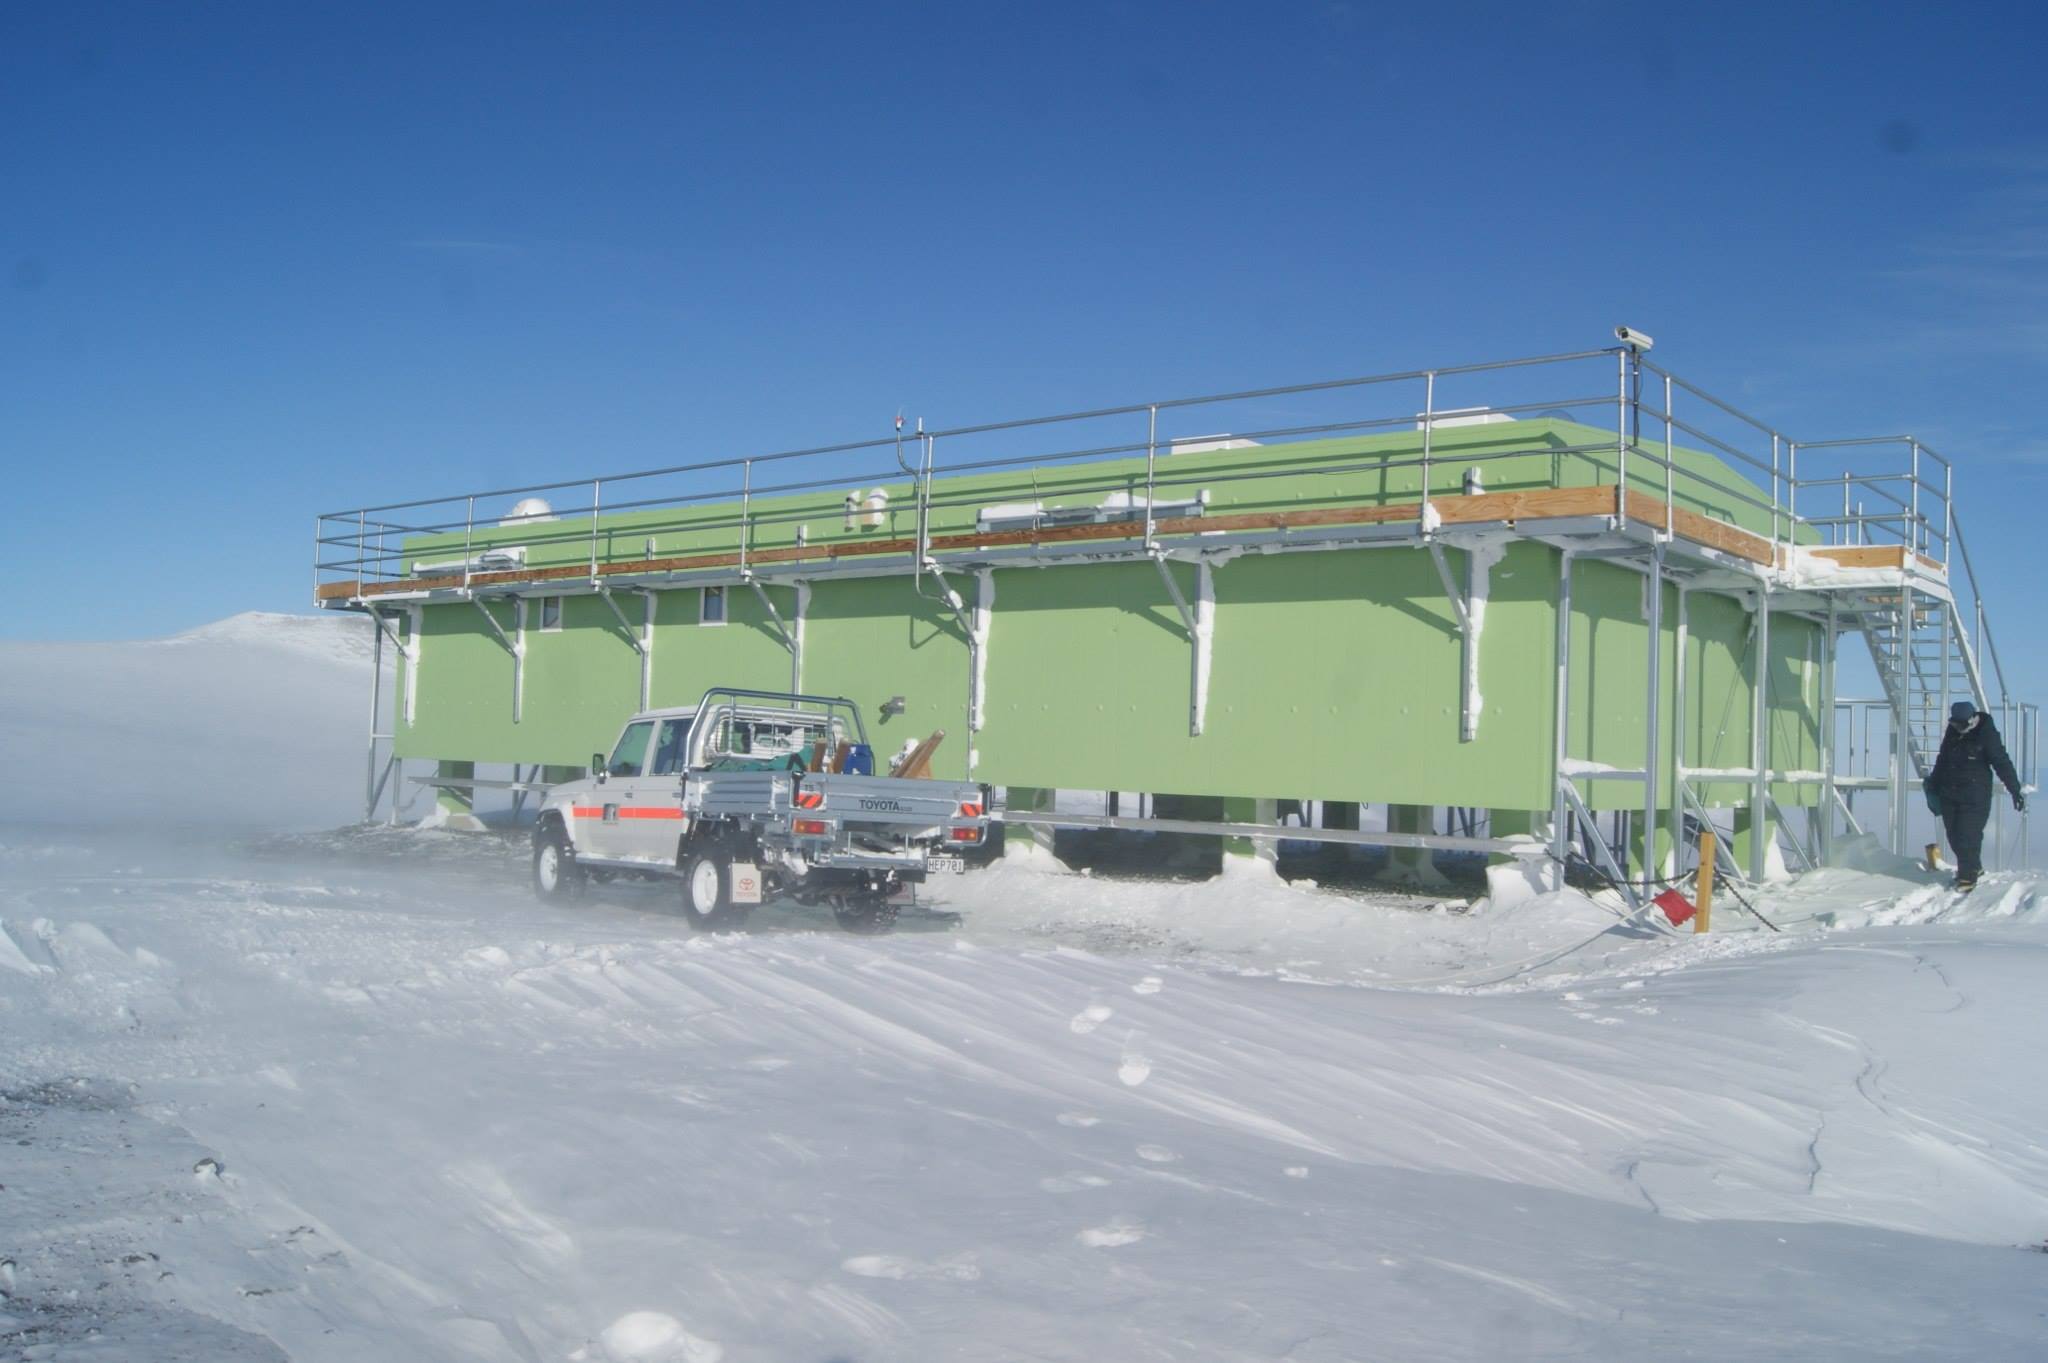 The research facility at Arrival heights. You can see the view from the building here https://www.antarcticanz.govt.nz/scott-base/webcams-weather
One of the measurements taken at Arrival Heights is a measure of the Ozone content of the atmosphere. These measurements have been made at arrival heights since 1988 and before that some measurements were taken from Scott Base. In 1974 a research meteorologist from the New Zealand Meteorological Service, Edith Farkas, traveled to the ice to set up the equipment needed to make ozone measurements in Antarctica. Edith’s travelogue to Scott Base makes for interesting reading, highlighting how the area has and hasn’t changed. Her recollections of travelling to Antarctica in full polar wear, her first sight of the light green buildings of Scott Base and being barely able to tear herself away from the views, ring true with my experience. Find out more about Edith here.
The work by early researchers such as Edith, along with other scientists around the globe, led to a long record of ozone measurements in Antarctica. Using these data, scientists at the British Antarctic Survey in the 1980s discovered reduced amounts of ozone over the Antarctic during the spring, what we now refer to as the “ozone hole”. The depletion of ozone existed not only over the Antarctic but also extended northwards to places such as New Zealand.
Ozone
The majority of ozone is found in an upper layer of the atmosphere called the stratosphere, about 20 to 40 kilometres above us. The ozone absorbs incoming ultra violet (UV) solar radiation and prevents it reaching the surface of the earth. UV radiation can be very damaging to life on earth so the protection of the ozone layers is vitally important. The amount of ozone in the atmosphere was being reduced by the introduction of chemicals into the atmosphere that destroyed the ozone molecules. The source of these chemicals was human activity. The most destructive chemicals were CFCs (Chlorofluorocarbons) that broke apart freeing up chlorine atoms, which then reacted with the ozone. One atom of chlorine is capable of destroying 100,000 ozone molecules.
The extremely cold stratosphere of the Antarctic winter helped in the formation of the chlorine molecules that would destroy the ozone in the following spring. Since the discovery of the ozone hole and the cause behind it, countries around the globe signed up to the Montreal Protocol in 1986 limiting the use of CFCs. The observations of the ozone continue to this day and the good news is that the ozone hole is now showing signs of recovery.
Friday 17th October 2014 - Scott Base
An early start for the end of the week to do a live cross with TV3 in New Zealand. Hamish Clark from TV3 and Rebecca the camera operator braved the elements from 6am to bring live pictures from outside the base. It was a tricky task and required almost all of the internet bandwidth of the whole base:
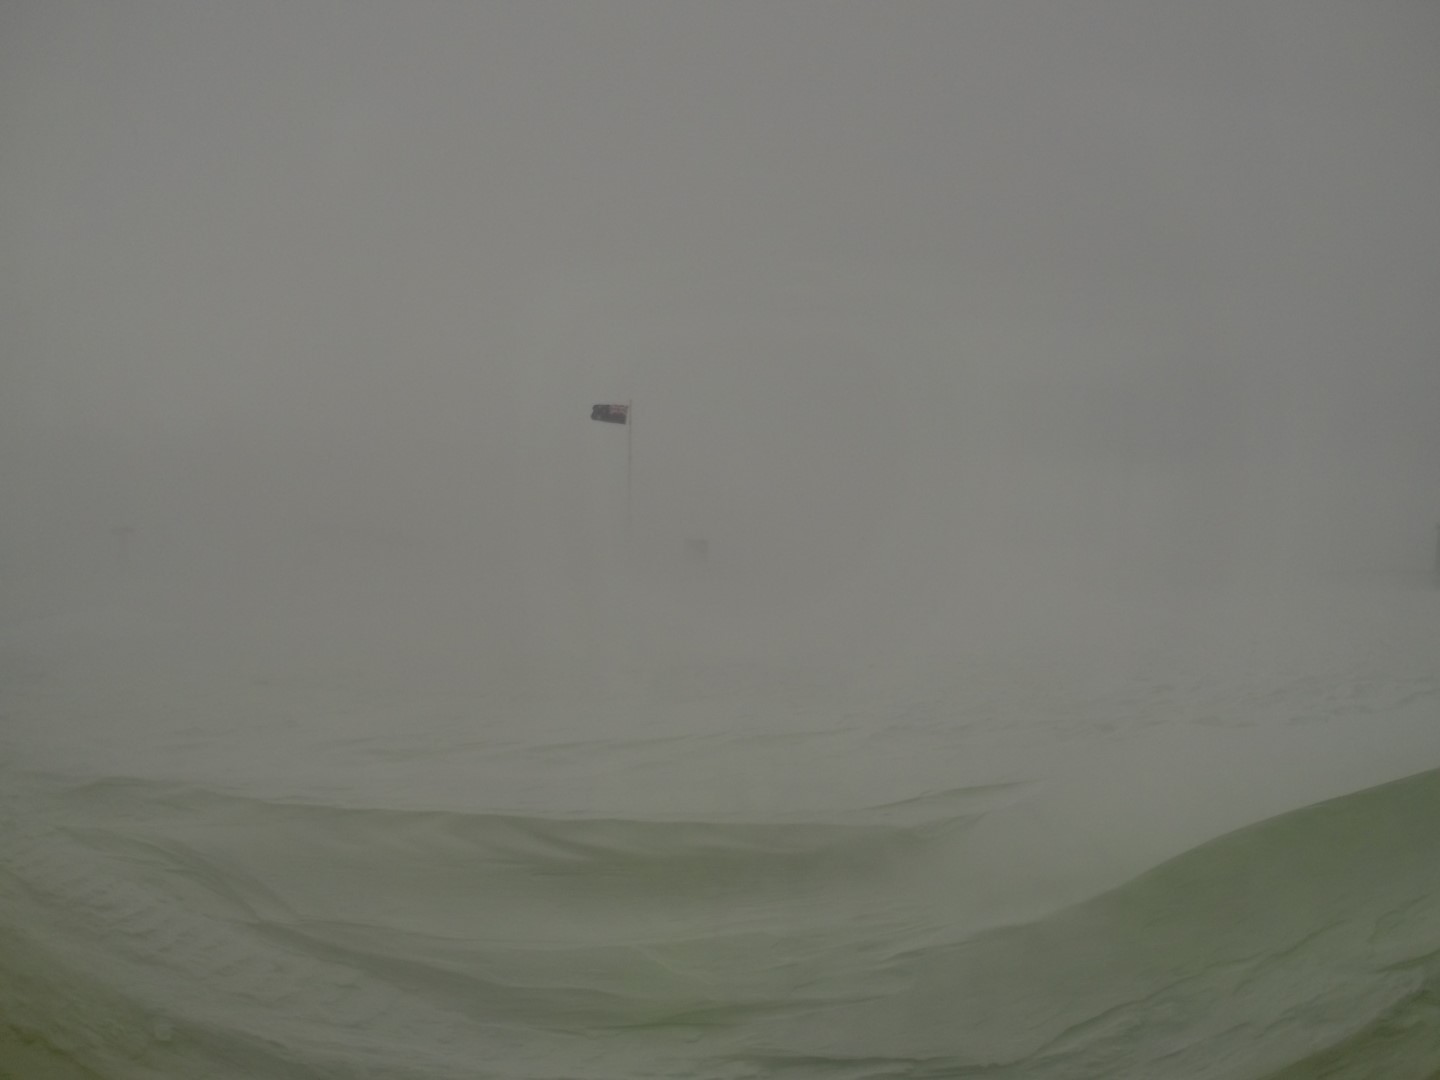
Here is the view looking out towards the Ross Sea. The flag pole is the original from Scott's ship RRS Discovery from 1902. The green building to the right of the image is part of the original Trans-Antarctic Expedition building built in 1957.
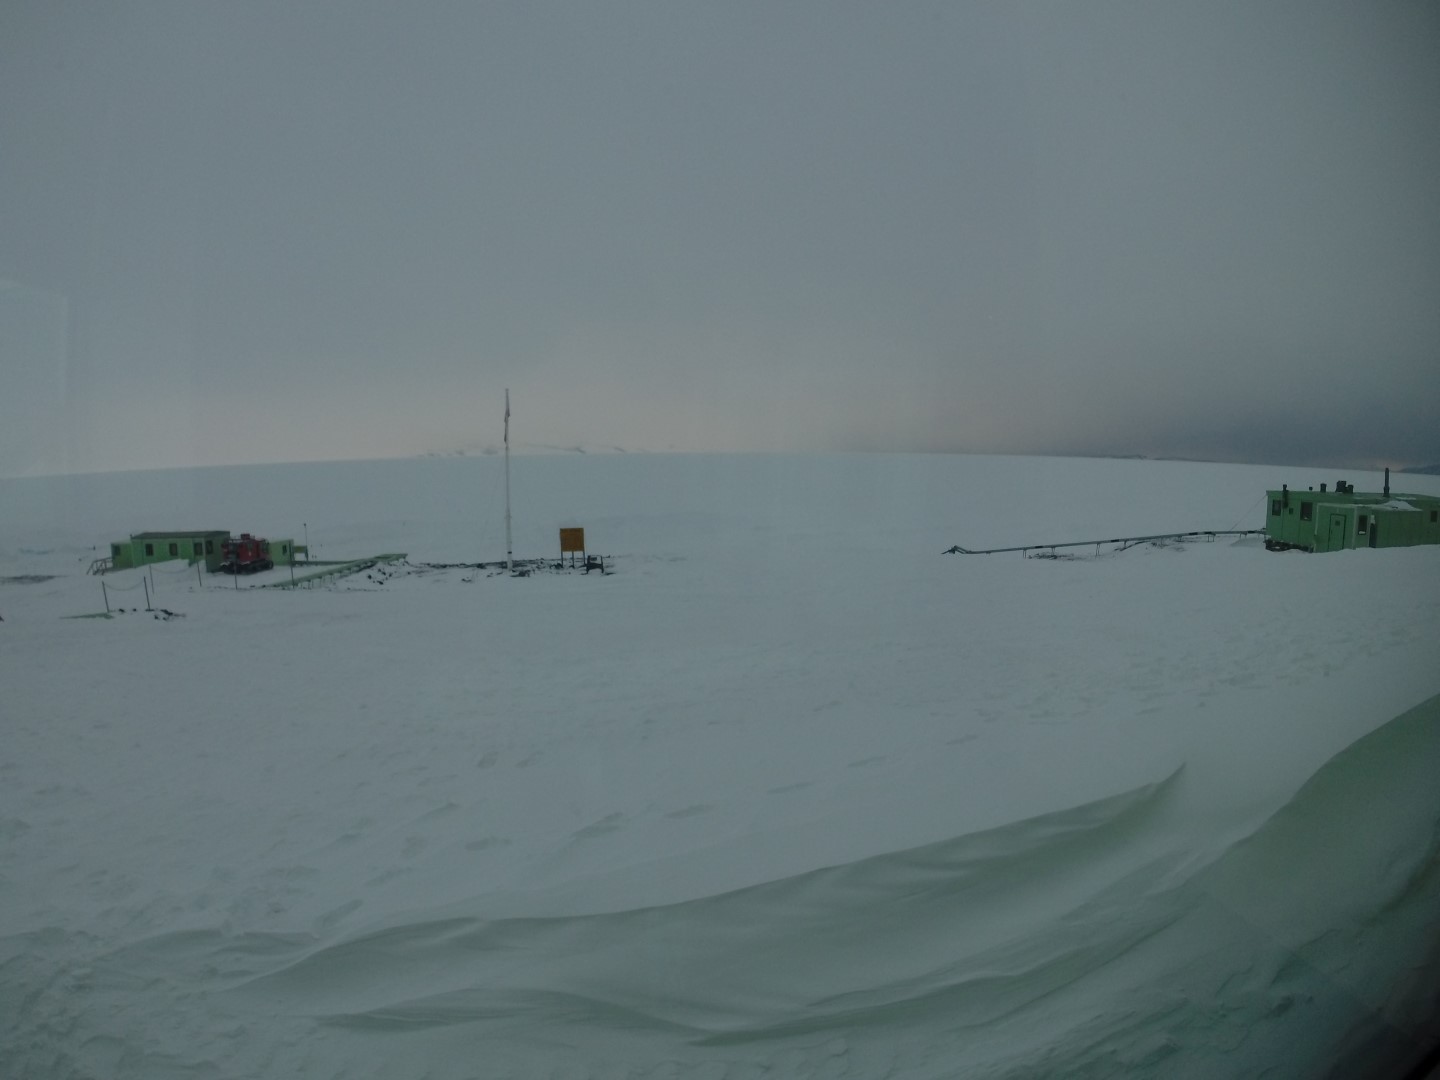
Although it was a cloudier start to the day, the weather was not bad at first. The flag is hardly moving in the breeze and just about visible is White Island in the distance. However, Antarctic weather can change very quickly.
By the time I was due to be on air, the winds had already started to increase and snow began to blow across the camera lens. By 8am the winds had increased substantially, forcing Hamish and Rebecca back inside.
Shortly afterwards a condition one was announced across the base tannoy. Here’s the image from just after 9 o’clock in the morning. You can just see the New Zealand flag blowing in the wind. The maximum gust recorded was 64knots or (118km/h).
As you may recall, a 'condition one' keeps everyone inside in the warm - that is, except for the weather observer who braves the elements every day at 0900 to gather the morning’s observations, even if that means they have to clip onto the safety line.
With the base on lock-down it meant staying inside until the weather conditions improved. Sadly this didn’t happen at all through the day and the winds howled on through the night. Here is a look at the wind speed trace through the day:
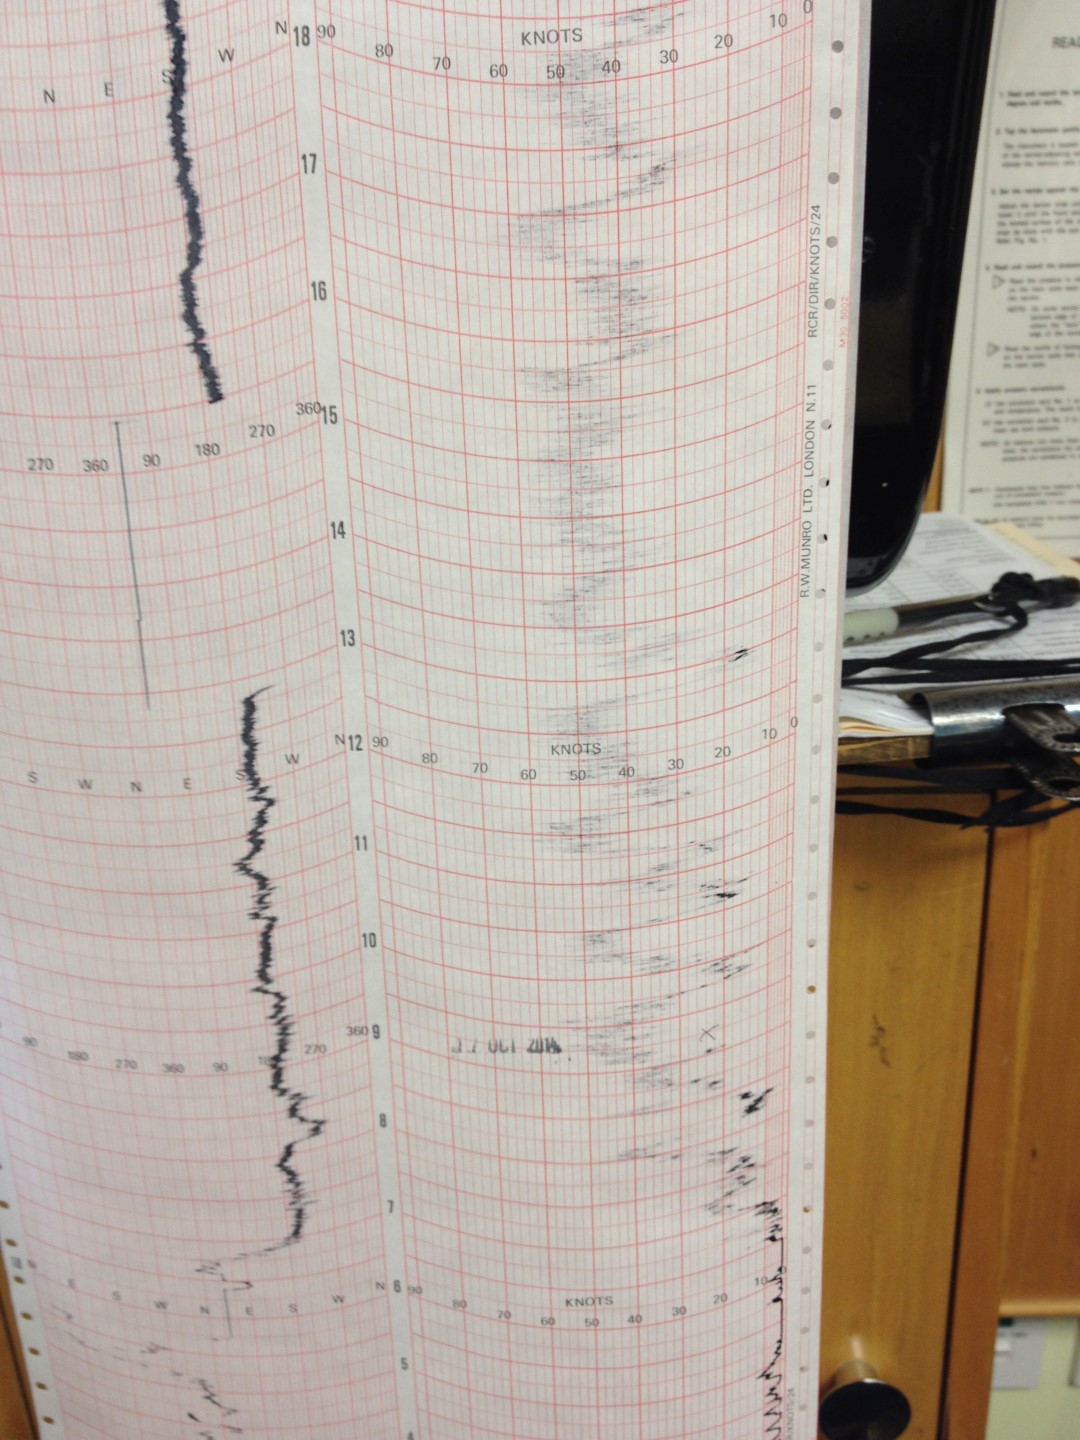
The winds at the start of the day were very light indeed. The time stamp marks 9am on the 17th and each broad red line marks another half an hour. On this chart, the lightest winds are on the right hand of the graph while the strongest are on the left.
Although we can’t get outside, there is plenty to be getting on with. As well as being a working environment with offices, workshops and labs, Scott Base is also a home to the crew. The base has beds for around 85 people, with kitchens producing fantastic food to keep them well fed and happy. A bar for after-work drinks, as well as an extensive library of books and DVDs, provide entertainment for those nights when it is too cold to get outside.
In better conditions there is also the chance to head out on some skis, try some kite flying, take a run round to McMurdo or wander on one of the walking tracks around the base.
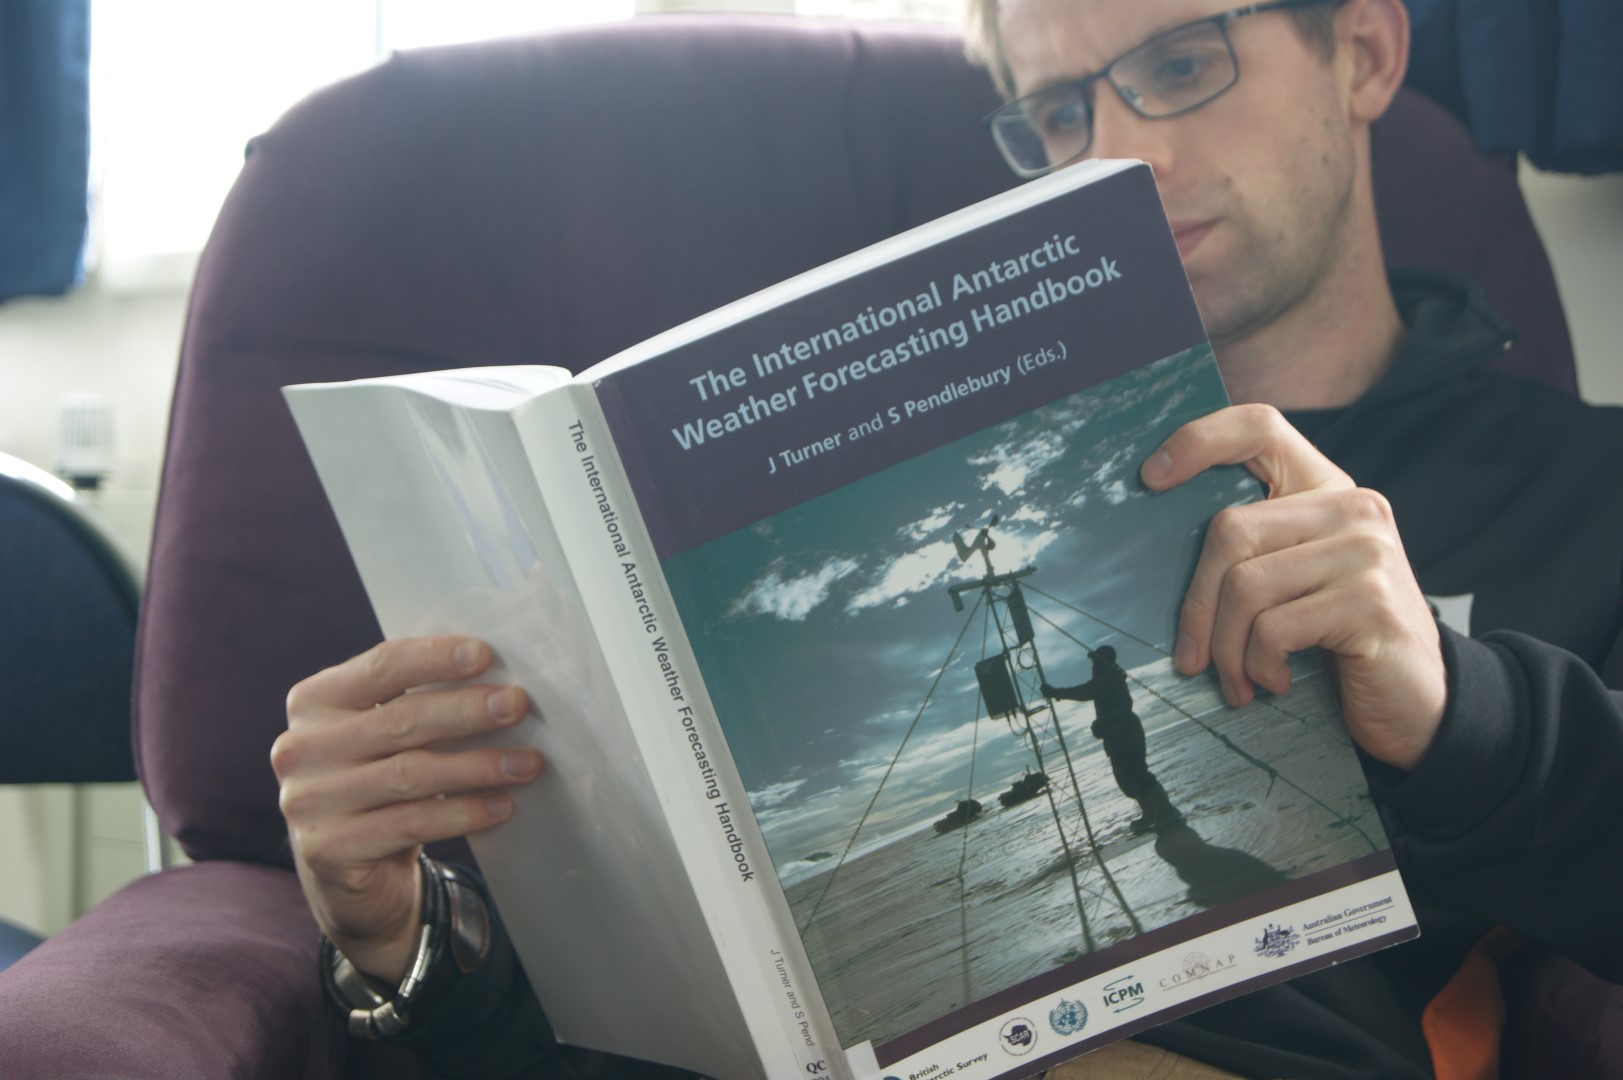 There is always something interesting to read at Scott Base.

Thursday 16th October 2014 - Scott Base
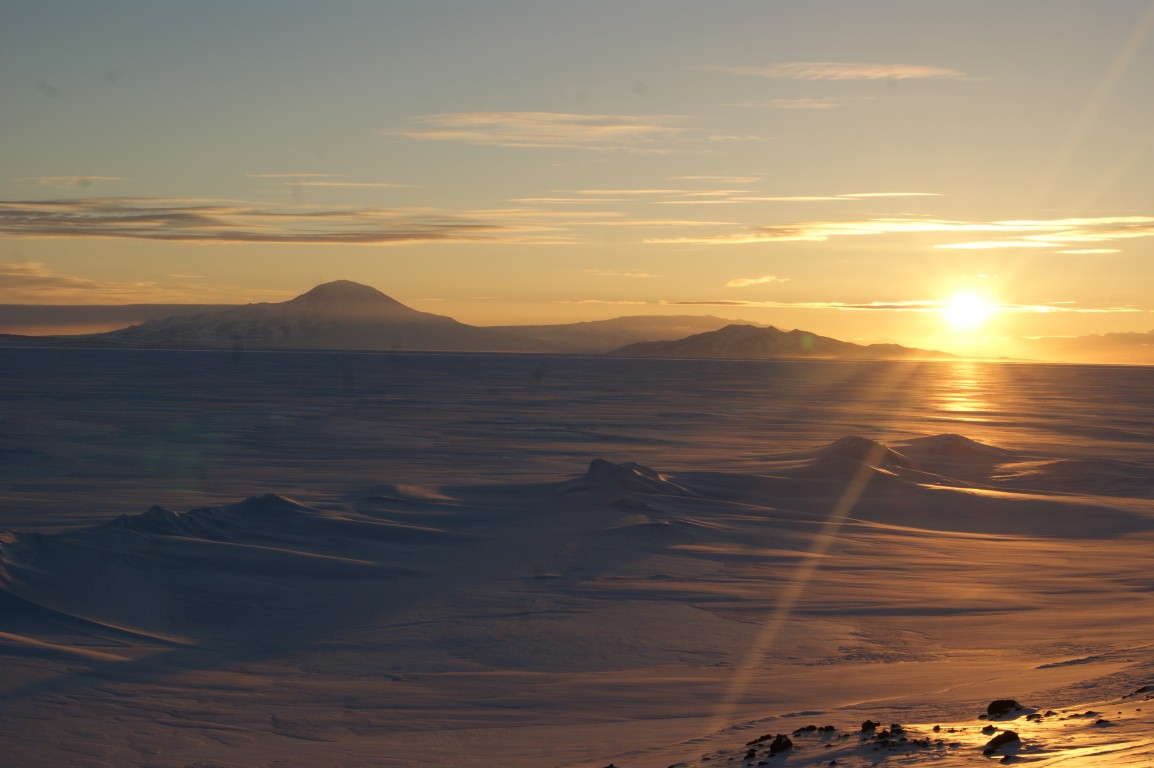 Sunset looking out towards Black Island and Minna Bluff.
Sunset last night was not until after 11pm and by 4am the sun was back up in the sky. In just under a week, Scott Base will see its last sunset of the season as the sun remains visible 24 hours a day during the summer.
The difference that these extended hours of sunlight makes is clear to see when looking at the average temperature for October: -21C, compared to that of December when the average temperature is back up to around -5C. Meteorological records have been made since the early days of the station. The image below is of Dr. Ronald Baltham with the Stevenson Screen.
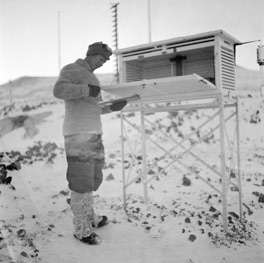 Dr Balham was part of the British Commonwealth Trans-Antarctic Expedition (BCTAE) which completed the first overland crossing of the Antarctic Continent from the Weddell Sea, via the South Pole, to McMurdo Sound, in 1957. Image Antarctica New Zealand http://scottbase50years.co.nz/keydates/index.htm#
These observations continue right to this day, with an observer heading out at 9am to record information about wind speeds, gusts, temperatures, cloud cover and visibility. Anemometers on high masts to the south of the station record the wind speed and direction. Antarctica is the windiest continent on the planet and there is a lot of wind to record.
As well as the winds, pressure measurements are made using a mercury barometer suspended on the wall. The readings from this are then corrected for temperature and altitude to give a sea level pressure reading. These first readings are made in the pleasantly warm comfort of the base, temperature around 21C. In order to make the next measurements we had to get back in our cold weather gear and head out to the instruments at the back of the base.
The observation station isn’t far from base, but as readings are made every day even in the strongest of winds and coldest of temperatures, it can be a difficult job to do. For those days with howling gales and poor visibility a guide rope leads the way to the Stevenson screen, a louvered white box housing the thermometers.
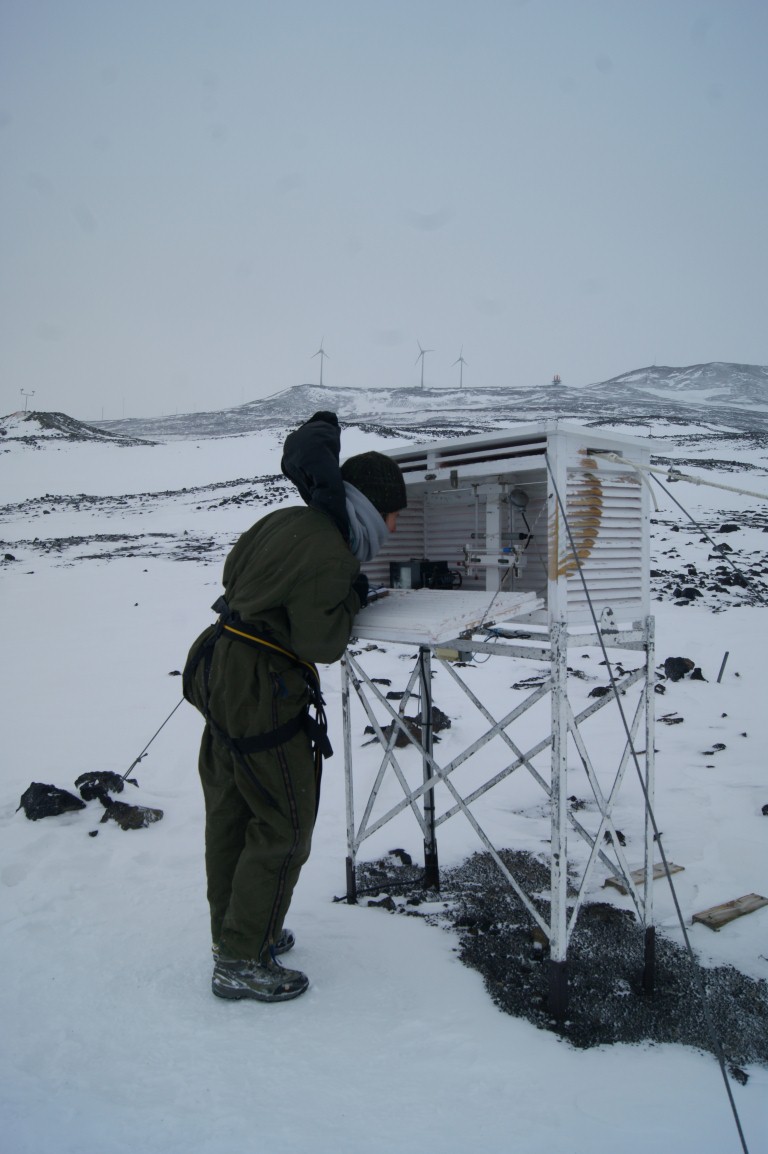 Kate from Antarctica New Zealand making the temperature observations at Scott Base. In the background the three wind turbines installed on Crater Ridge behind Scott base in 2010 are just visible.
The Stevenson screen protects the thermometers from the harsh conditions, but allows air to freely pass over them and keeps them in the shade. Inside the screen are three separate thermometers. The first, like most thermometers, records changes through the day while the others are used to record the extremes for the day, one recording the maximum and one recording the minimum.

While the observer is out in the field they also take a look around them and make an observation on the visibility and also the cloud cover. The best way of measuring visibility is to use local landmarks. At Scott Base the visibility can be as poor as less than 50m, when the observer cannot make out the nearby automatic weather station, or as good as greater than 50km, when Minna Bluff can be seen away in the distance to the south of the base.
All these observations are collected and sent back to the climate database managed by NIWA. The observations from Scott Base join thousands of other observations from across the world which are fed into computer programs modeling the atmosphere and its physical processes. The observations are also streamed live on the Antarctic New Zealand website.
In New Zealand, MetService alone maintains almost 180 observing stations. In Antarctica, a continent so large you could fit New Zealand into it sixty times, there are only around 100 automatic weather stations sending back observations and information about the current conditions. Although the region is data sparse, the information is vital for computer models to get a good understanding of the current weather as a starting point for their predictions.
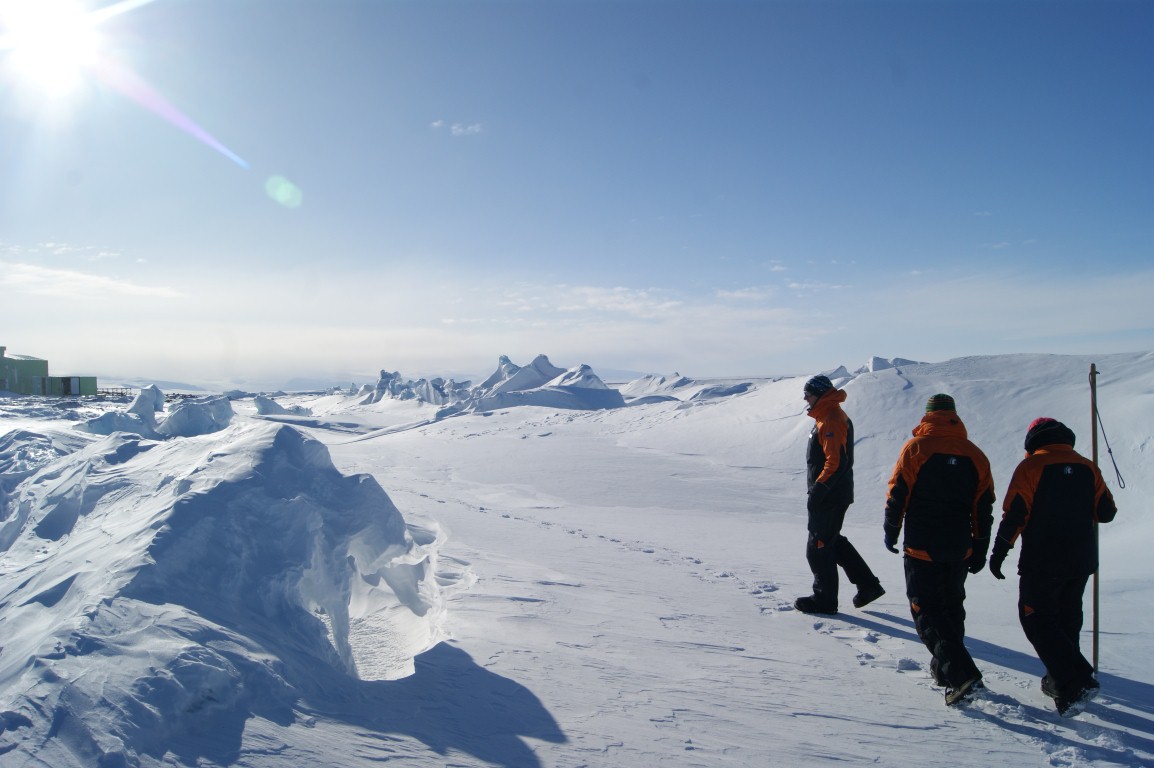
Observations from stations such as Scott Base are incredibly valuable in the understanding of our changing climate. The long record, and dedication of weather observers from all around the globe in maintaining it, has been a vital resource for analysing trends and changes in the atmosphere. Afternoon activities involved heading out onto the sea ice around the front of Scott Base. In front of the base are a series of features called pressure ridges. These ridges form when pieces of sea ice break and are pushed into each other by winds and ocean currents.
 MetService marine forecasters issue forecasts that cover the ocean right down to the ice edge. As well as warning of high seas and gales, these forecasts also contain warnings when the combination of extremely cold air and moisture bring the risk of large amounts of ice forming on ships as they move through the area. You can find the latest Southern area marine forecast here: http://www.metservice.com/marine/high-seas/#southern
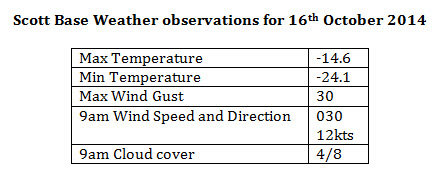
Wednesday 15th October 2014 Christchurch to Scott Base.
Instinctively I woke up at 4:50 in the morning and checked my phone – there was no text saying the plane was delayed; this was it. Time to gear up, bag my back and head southwards to the ice.
Flying to Antarctica is a little different to the normal everyday flights that leave from Christchurch. Passengers and supplies head southwards with the United States Antarctic air force. We traveled down on a C-17, it is like flying inside a massive warehouse.
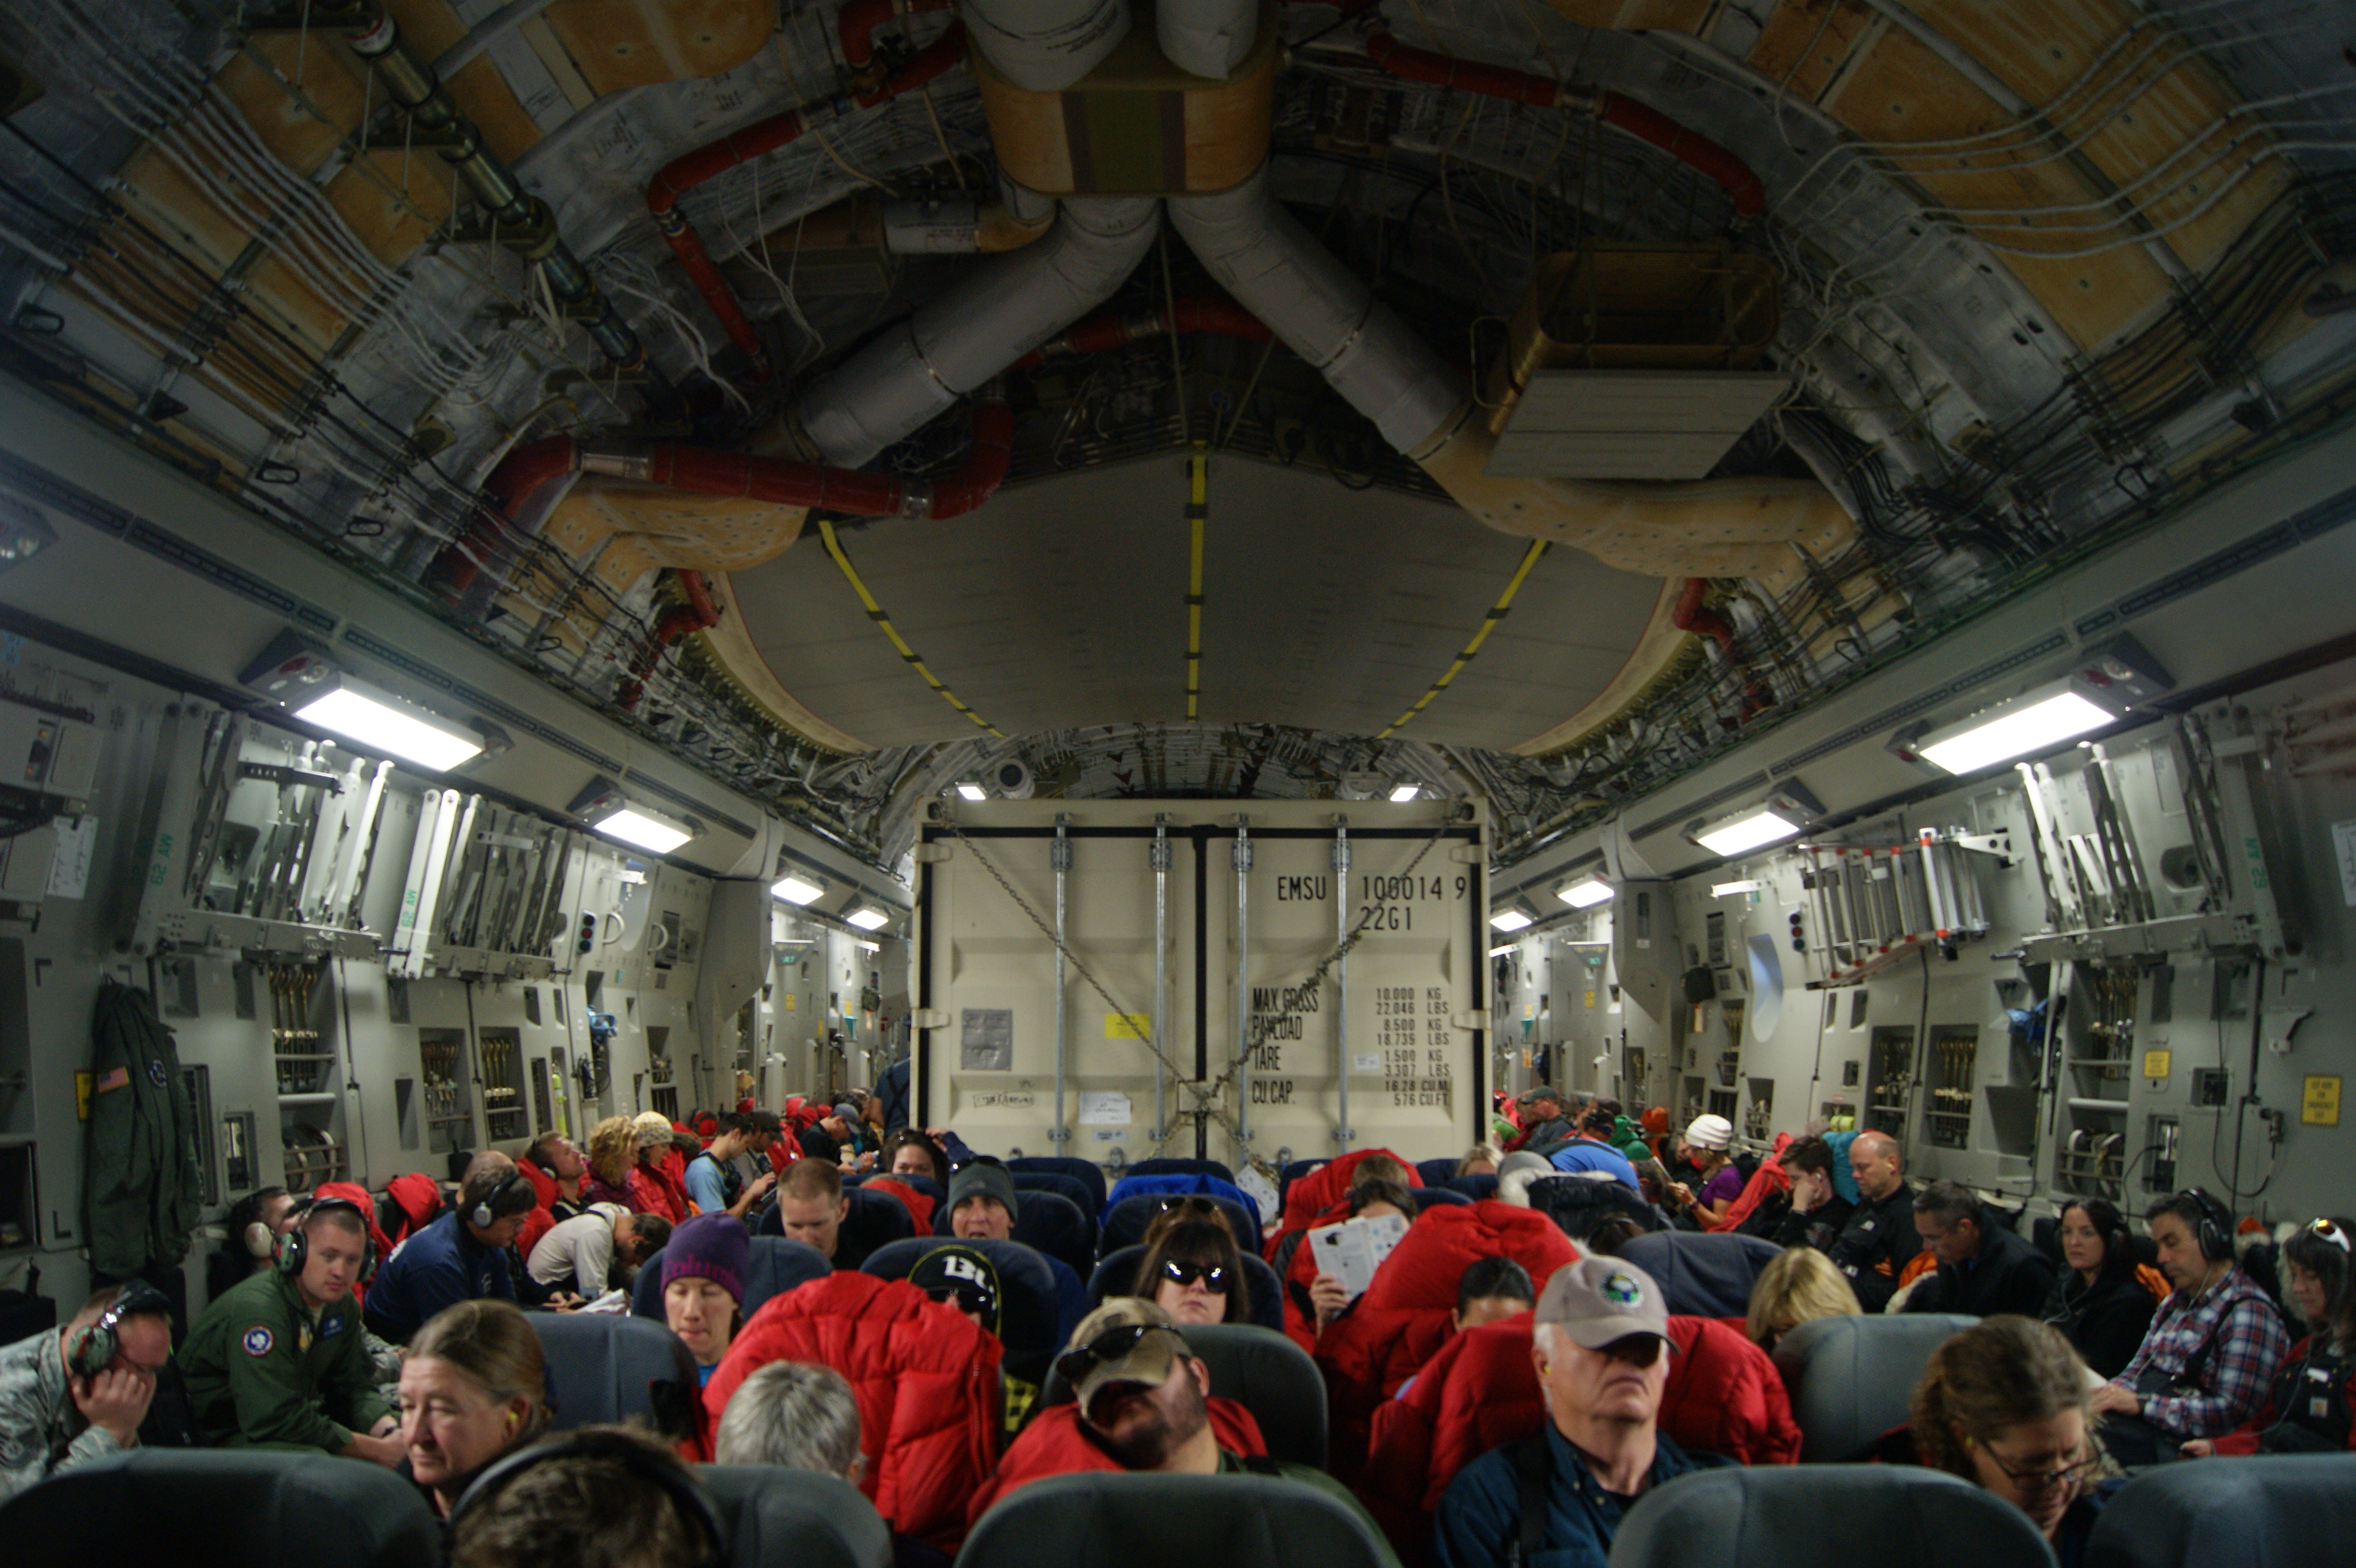 Sleeping is a popular past time on the flight south with ear plugs to cut out the sound of the engines.
Although it lacks some of the mod cons of a regular flight – there are no in flight movies or cabin crew - the flight is spectacular. Everyone on board is kitted up in their ECW (Extreme Cold Weather) gear and the sense of anticipation on board is palatable.
Flying almost due south from Christchurch over the Sea Ice and McMurdo Sound the flight down took around 5 hours with a smooth touchdown on the icy runway of Pegasus Field around two in the afternoon. The temperature as we stepped off the plane onto the Ross Ice Shelf was around -19C with excellent visibility across the ice shelf and across to Mt Erebus in the distance.
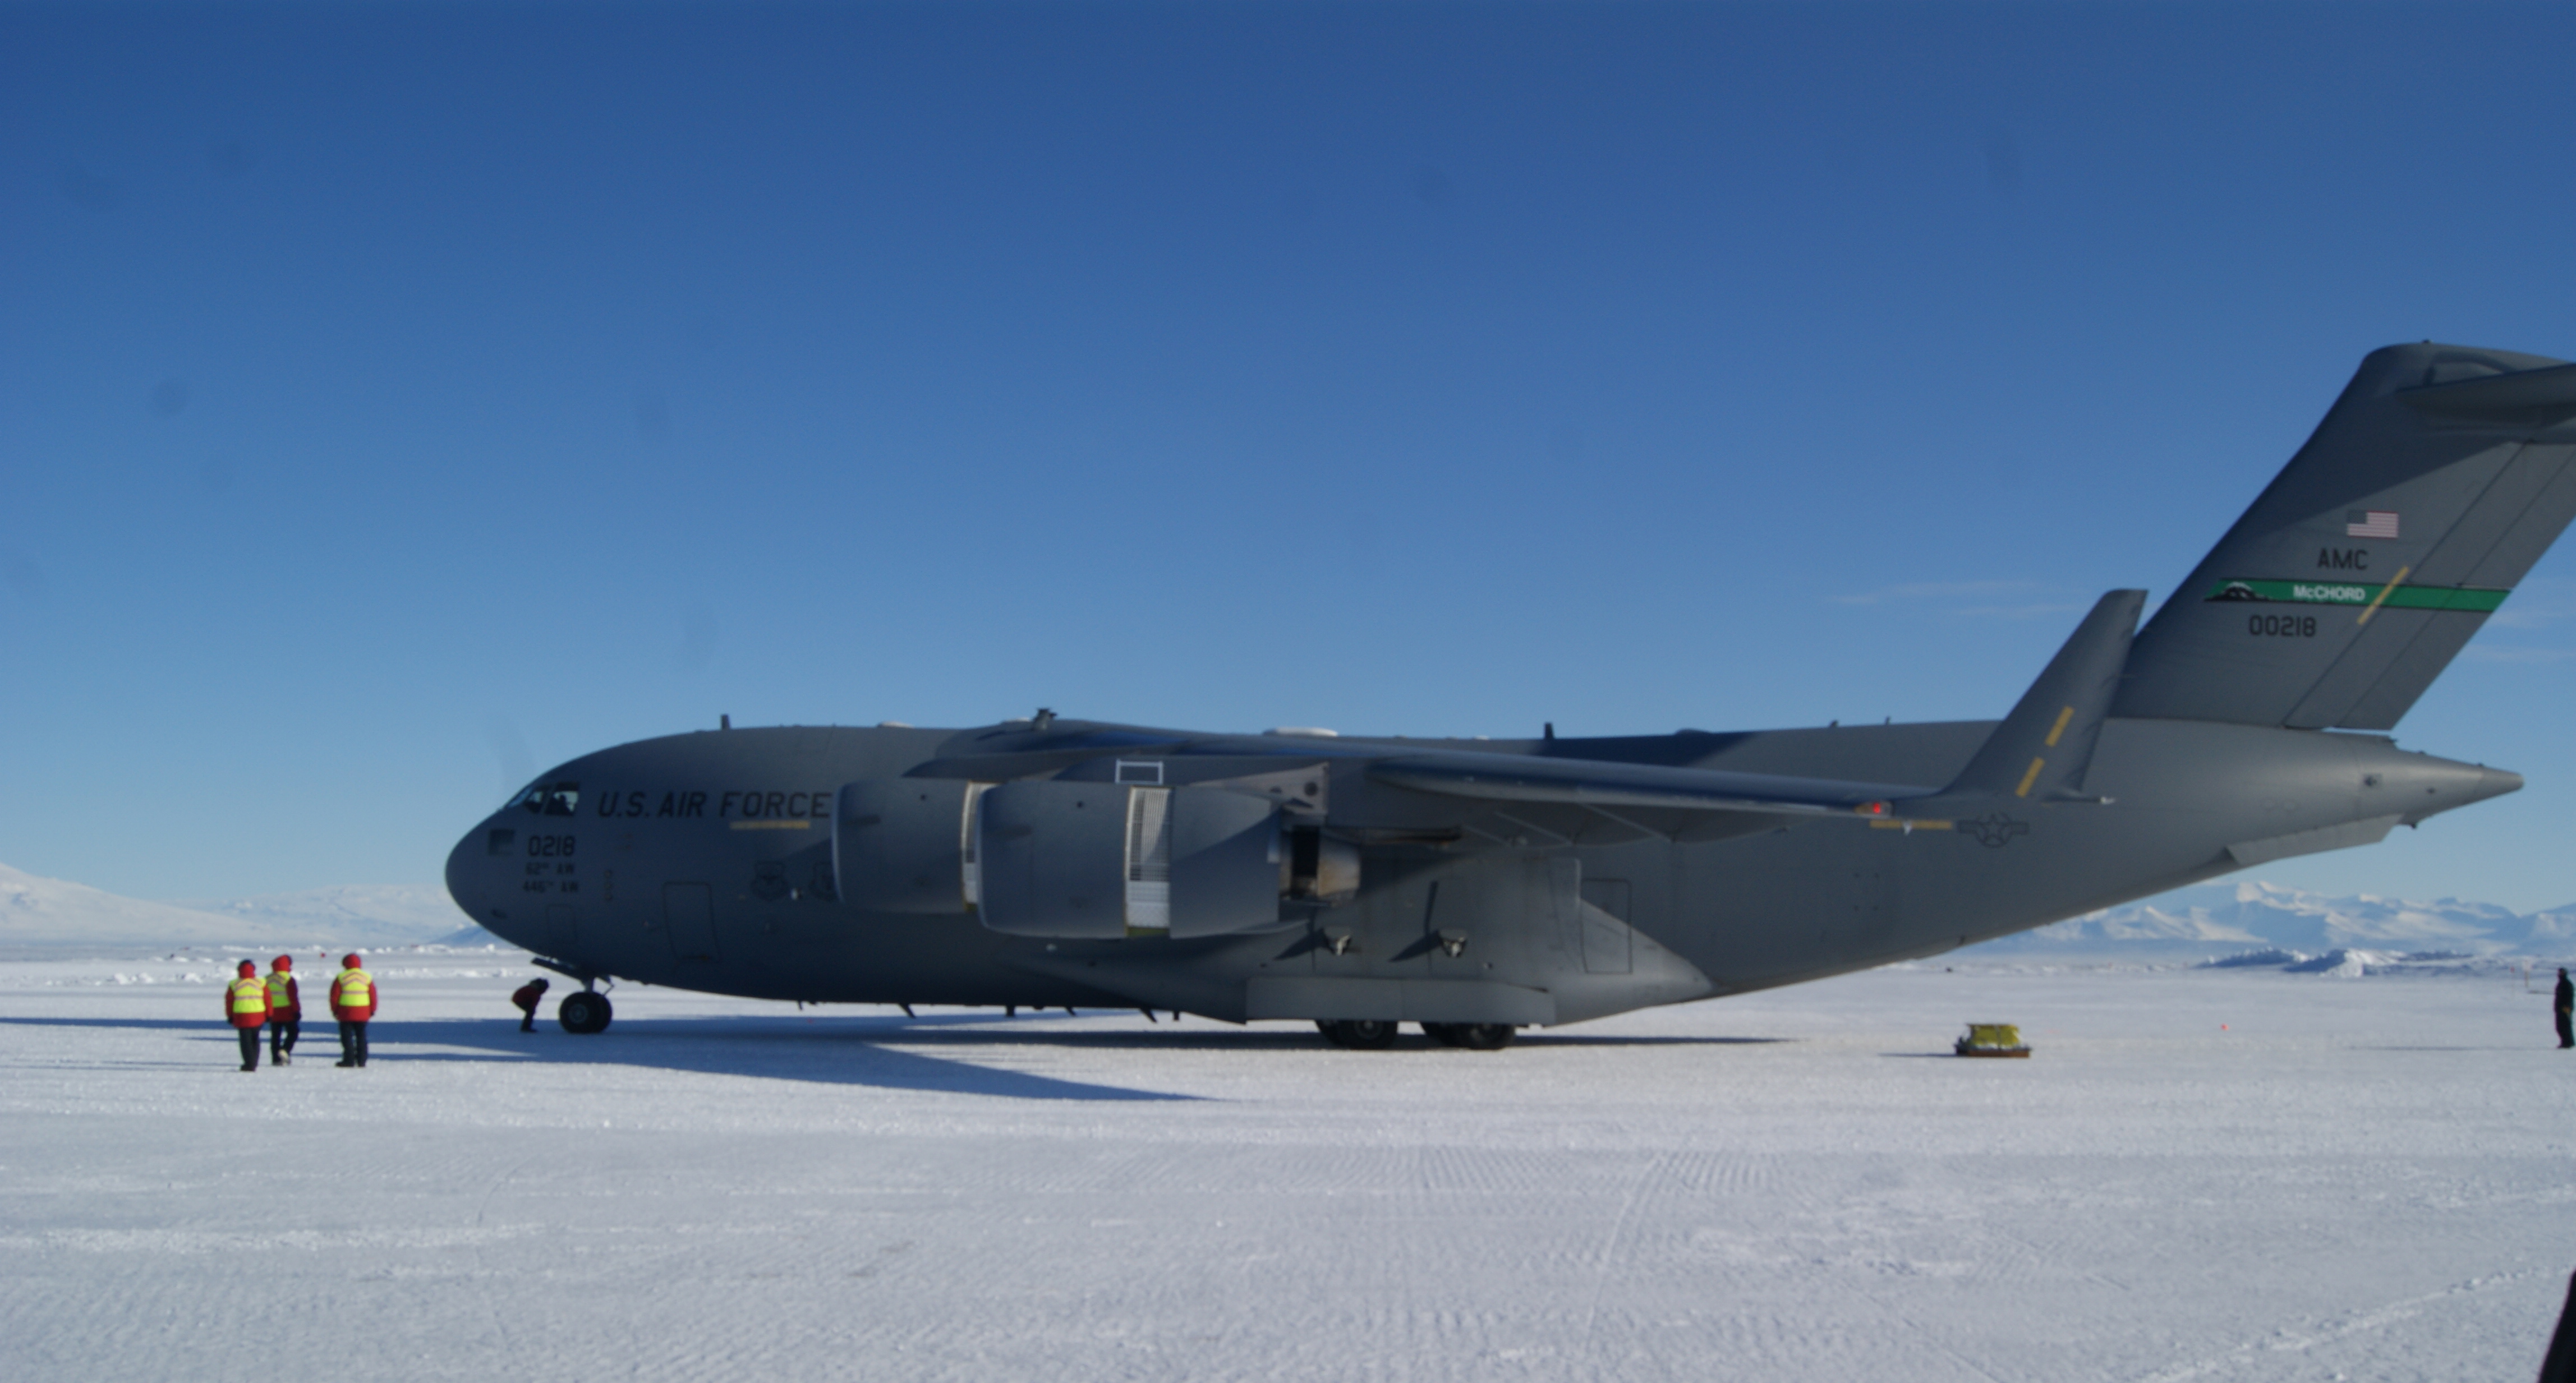 The C-17 at Pegasus Field, Antarctica
It is a short drive from Pegasus Field to Scott Base where I will be staying for the next few days. While I am in Antarctica I will be a guest of Antarctica New Zealand whose permanent home on the ice is Scott Base on the coast of Ross Island. Their goal is to maintain New Zealand’s operational presence in the Ross Dependency for the benefit of present and future generations of New Zealanders. Key activities include supporting scientific research, conserving the intrinsic values of Antarctica and the Southern Ocean and raising public awareness (in part through arts, media and youth programmes) of the international significance of the continent.
There has been someone constantly in the base since 1957, staying not only through the summer but also through the long Antarctic winters. At this time of year, October, the base staff switch over from the winter team to the summer team.
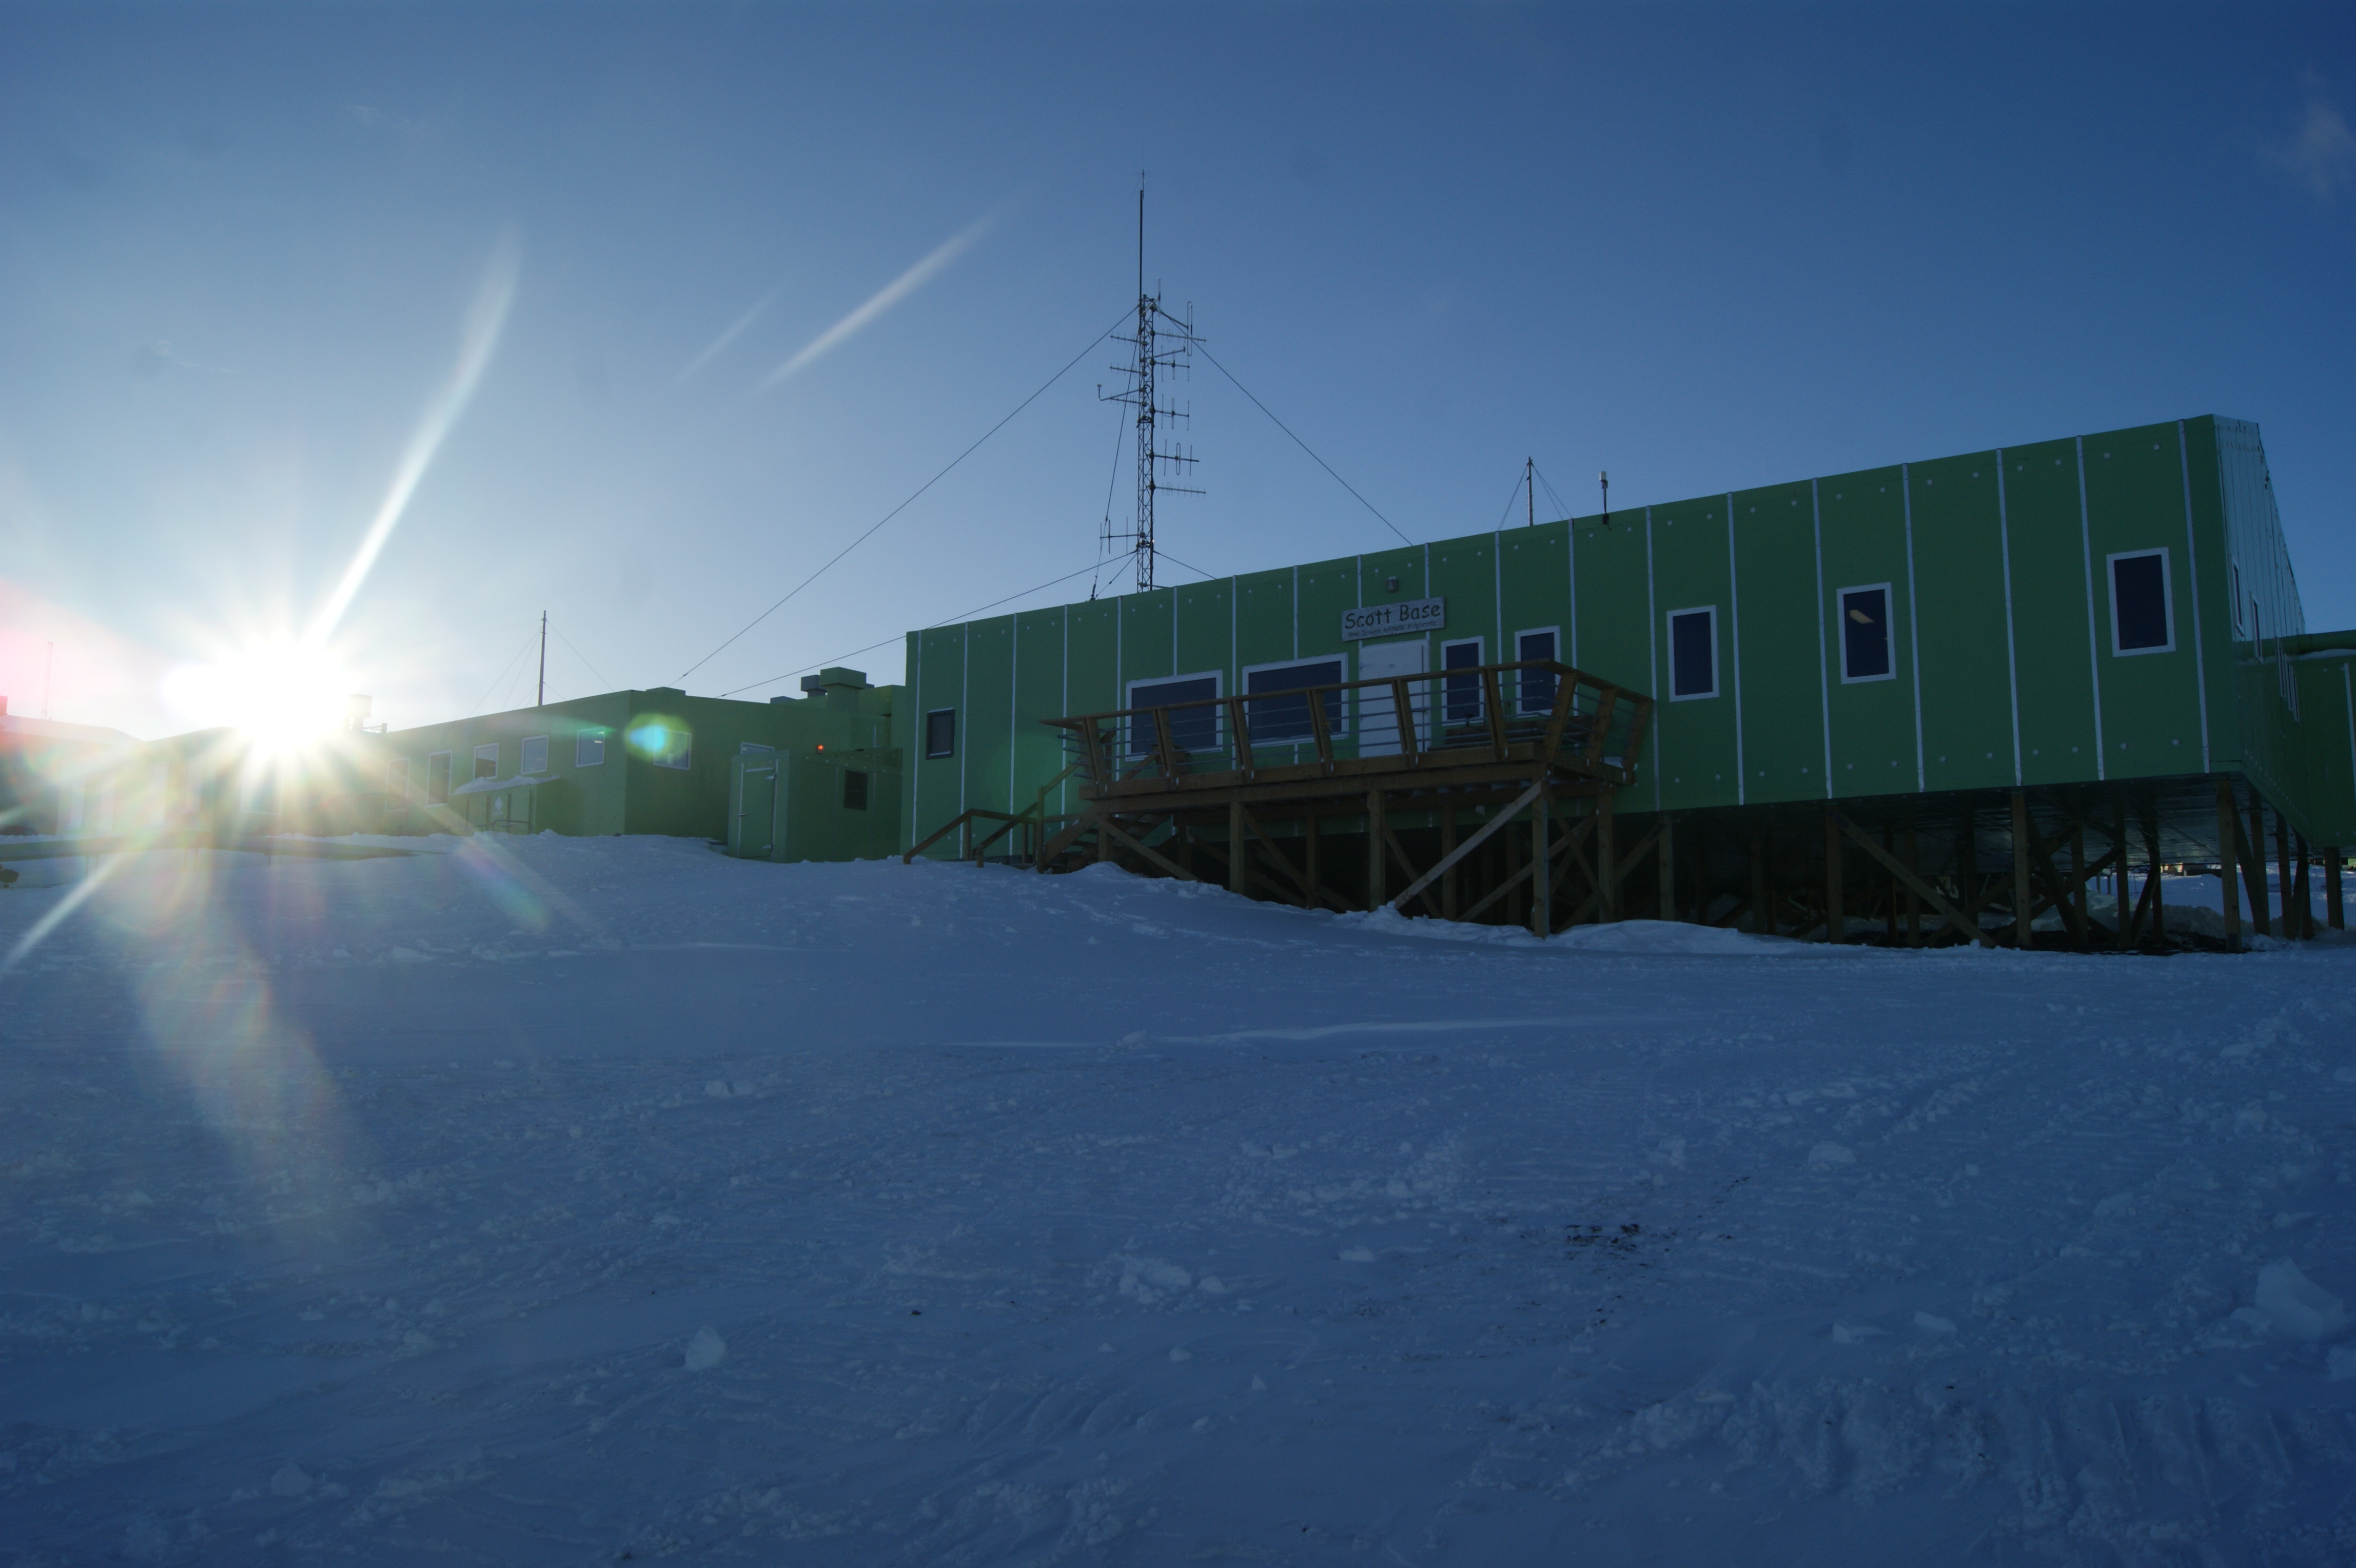 The front door to Scott Base, Antarctica. My home for the next few days.
There are currently around 60 people on base. The base sleeps 85 people at the peak of the year while over winter the number drops to 14. The base consists of a number of buildings connected by a network of corridors which take you from the Hilary Field Centre, which has everything you need for an expedition, right through to the Hatherton Lab which, amongst other things, is home to some of the weather instruments.
You can find out more about the base on the Antarctica New Zealand webpage. When your nearest hospital is a considerable distance away, safety is of paramount importance. For the team at Scott base the weather is always a major consideration before undertaking any work outside. The weather conditions are divided into three categories, each of which has an impact on the amount of work that can be carried out.
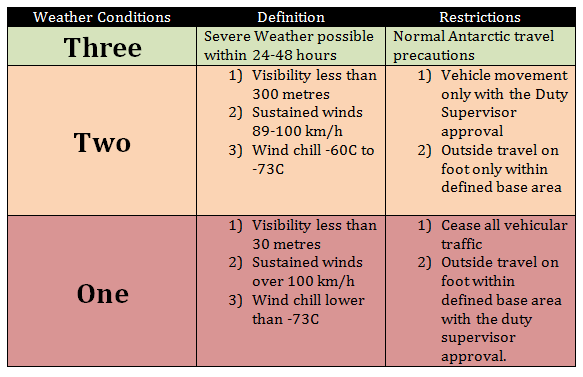 Temperature, wind speed and visibility are important factors when working in Antarctica. These are the three weather conditions that we have on base.
The wind speed and the temperature are the biggest concern for Antarctic workers, with over-exposure possibly leading to frost nip or frost bite. Today was definitely a condition three kind of day.
Tuesday 14th October 2014 - Still in Christchurch!
 Hello once again from the garden city, temperatures today are set to climb above twenty degrees Celsius in Christchurch which would be excellent news except I have packed for a distinctly colder climate. The weather at Scott Base is once again forecast to worsen around the middle of the day with winds set to strengthen and gust in excess of 50km/h leading to blowing snow, reduced visibility and a 24 hour flight delay. Here’s the view from Scott Base this morning. On a good day from the base you can see Mount Erebus, the most southerly active volcano in the world. Today is not one of those days.
 Conditions at Scott Base Tuesday October 14, 2014
For the latest view and conditions at the base head to https://webmedia.antarcticanz.govt.nz/weather/sbweather.html Although the delays add an extra two days to my travels, it pales into insignificance to the journey Captain Scott made from New Zealand to Antarctica in 1910. In all, it took his ship the Terra Nova 36 days to sail from Port Chalmers to Cape Evans on Ross Island. He also took with him 17 ponies and 33 dogs so that makes my luggage look a lot better.
To find out more about the Terra Nova expedition and more about Antarctic exploration check out the Antarctic Heritage Trust: http://www.nzaht.org/ and if you are in Christchurch the excellent International Antarctic Centre: http://www.iceberg.co.nz/
While I am waiting for the weather to clear, let’s have a look at what makes the continent so unique.
Why is it so cold?
The Sun is an enormous energy source. Energy in the form of shortwave radiation is absorbed by the Earth and atmosphere, which warms and emits longwave radiation. The balance between the amount of energy coming into a system and leaving is the driving force behind the different climate bands on the globe.
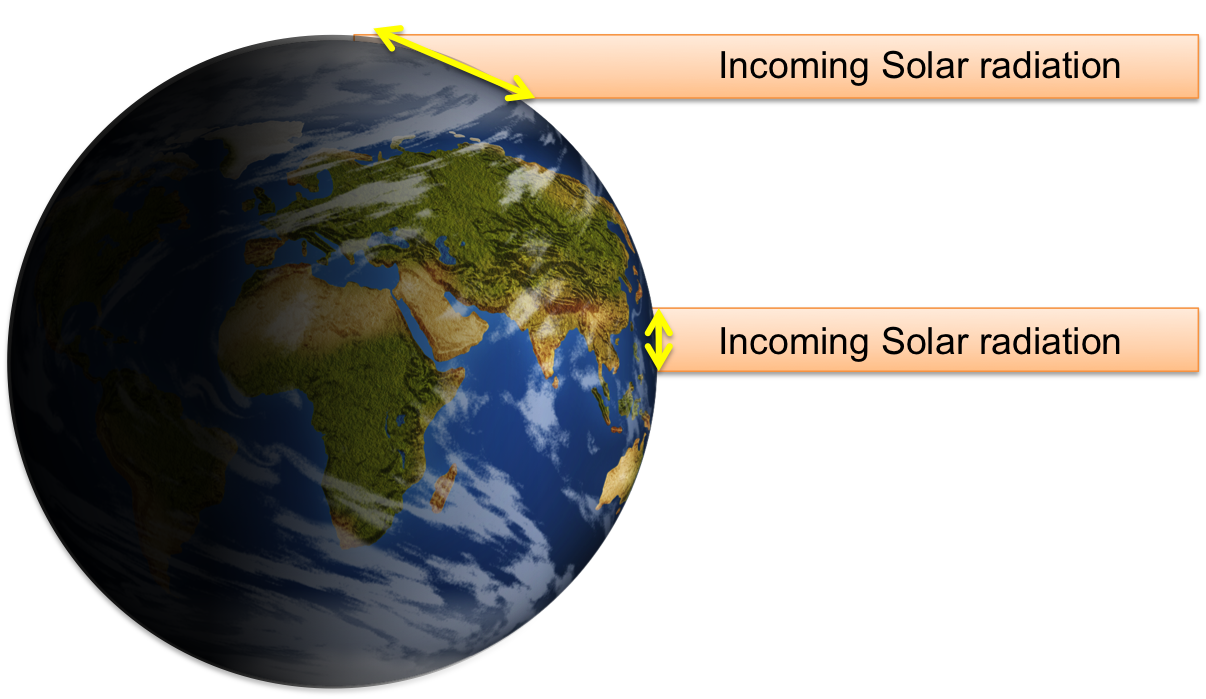
The diagram above shows how the shape of the Earth effects the distribution of the energy at varies parts of the globe. About the equator the energy from the sun is spread over a much smaller area than at the higher latitudes of the Earth. At the tropics (between 0 and 23.5°) the energy received is about 90% of that at the Equator this reduces to about 70% for us in New Zealand and by the time we reach the Antarctic circle, 60°S that figure is reduced to 40%.
The rotation of the earth results in our day and night cycle. This in turn leads to a maximum of incoming radiation when the sun is at its highest point in the sky, local noon, and a minimum at night. As well as this daily, or diurnal, cycle, another cycle in energy amounts is also well know and observed – the seasons.
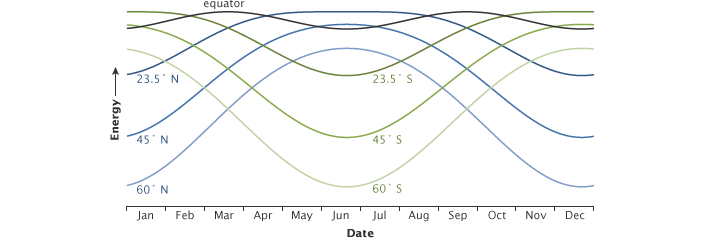 The peak energy received at different latitudes changes throughout the year.
This graph shows how the solar energy received at local noon each day of the year changes with latitude. At the equator (grey line), the peak energy changes very little throughout the year. At high northern (blue lines) and southern (green) latitudes, the seasonal change is extreme. (NASA illustration by Robert Simmon.) http://earthobservatory.nasa.gov/Features/EnergyBalance/page1.php
It is the imbalance between this incoming solar radiation and the outgoing long wave radiation that determines if there is a warming or cooling trend in that part of the globe. The amount of long wave radiation emitted is related to the temperature; at the tropics more energy is radiated back into space compared to at the poles. However, the difference between the amount of long wave radiation emitted in the tropics and the poles is much smaller than the difference in incoming solar radiation so it is that which dominates the trend.
The surface of the planet also has an impact on the amount of solar radiation that is absorbed and how much is reflected. Dark surfaces, like oceans, absorb a lot of energy while light surfaces such as snow and ice reflect much more of the solar radiation, adding to the cooling trend at the poles. Fingers crossed for a break in the weather for Wednesday.
Monday 13th October 2014 - Still in Christchurch

It is another brilliant blue sky in Christchurch, with light winds and rising temperatures. Alas, the same cannot be said for my intended destination, Pegasus Field on the Ross Ice Shelf, a short drive away from Scott Base and the American base at McMurdo Sound. The flight time to the ice from New Zealand is usually between 5 and 8 hours, depending on the type of aircraft.
Unlike other parts of the world, landing at an alternative airport is not a viable option for planes traveling to Pegasus field from Christchurch if the weather looks like it will not be suitable for landing. For some aircraft, 65S marks the Point of Safe Return (PSR), where the plane will turn around and head back to Christchurch if it cannot land in Antarctica. Other aircraft like the C-17 can get all the way to Scotte before having to turn back.
To get so tantalisingly close and having to turn back is no-one's idea of fun and represents a huge loss in fuel, time and money. In order to avoid these boomerang flights, travel to Antarctica is a very fluid type of travel and weather forecasting is a major player when asking the 'to fly or not to fly' question.
So what is the forecast for Pegasus Field?
In aviation, weather forecasts look different to the forecasts that we are see on TV and in the newspaper. As well as thinking about the weather at different heights in the atmosphere, pilots and forecasters need to be aware of areas of very cold, moisture laden air in the atmosphere which can lead to ice forming on the wings and bodies of aircraft, as well as watching out for areas where a rapid change in wind speed or direction could cause turbulence.
With lots to say and little time to say it, and making sure the message can be understood in many languages, aviation forecasts are written in a type of code. Here is a look at the observations in a METAR (weather report) and the forecast or TAF (Terminal Aerodrome Forecast) from Pegasus Bay on the morning of the 13th. These forecasts are prepared by the meteorologists at McMurdo Sound.
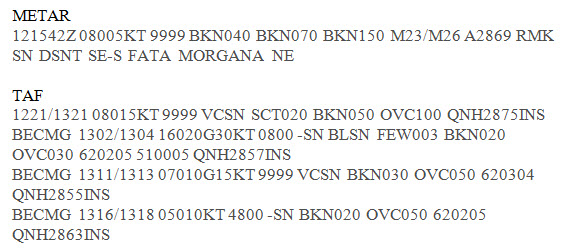 Pegasus Bay METAR and TAF from 13 Oct 2014
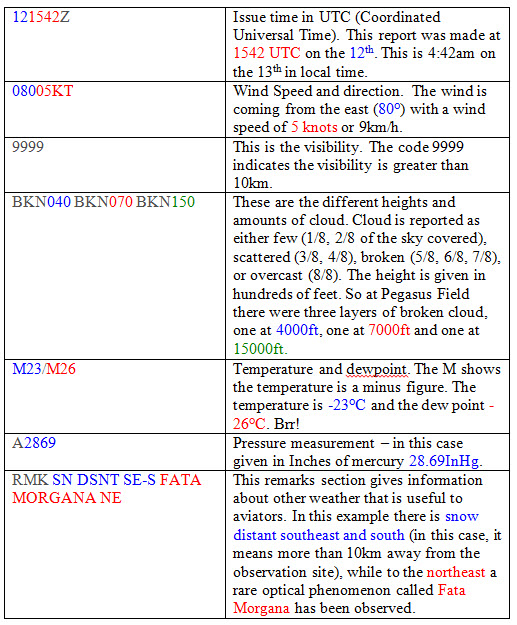
It can be tricky to break down the code, but let's look at the information we can get from the METAR and the TAF. First let's decode the METAR:
 So from the METAR we know it is cold, with light winds, good visibility and broken cloud. So why didn’t we fly down? The answer is what we read in the second block of text, the forecast (TAF). The format is similar and uses some of the same codes as the METAR. Here’s a breakdown of the first few sections of the forecast conditions. Let’s take a line at a time:
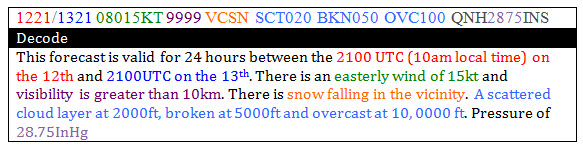
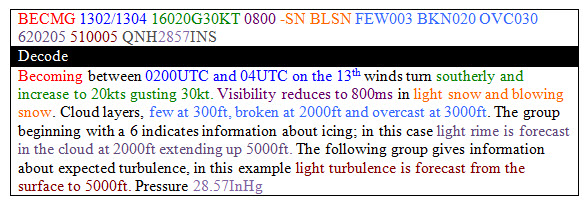 Looking at the next few BCMG groups, we can see that the weather gets better and the winds ease down. Can you work out what time the winds should ease back down to 10 knots?
 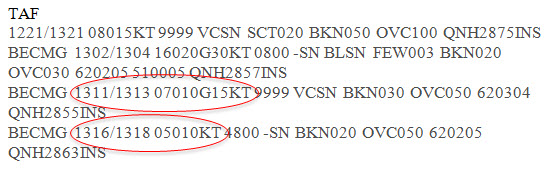 Phew! That’s a lot of information. Elements like the weather type are selected from a list of abbreviations, while code tables are used to build up the information in the icing and turbulence forecasts.
You can find more about the weather codes used in TAFs and METARs from the New Zealand Civil Aviation Authority: https://www.aviation.govt.nz/airspace-and-aerodromes/meteorology/how-to-interpret-aviation-weather-information/ Fingers crossed for some better flying weather tomorrow!
Sunday 12th October 2014 - Wellington to Christchurch
The first leg of my Antarctic adventure was just a short one, taking me from MetService head office in Wellington over Cook Strait to Christchurch, the gateway to Antarctica. Christchurch is not only home to Antarctica New Zealand but also provides a logistical hub for the American and Italian programs based on the continent.
During the summer, regular flights depart from Christchurch taking supplies and personnel down to the ice. Some 3832km to the south of the garden city is my final goal, Scott Base. Scott Base is New Zealand’s permanent base in Antarctica, situated on Ross Island at a latitude of 77S. The base is home to up to 86 people during the summer months. An over-winter crew of 14 make sure the base keeps running through the cold, dark Antarctic winter.
Situated on the edge of the vast continent, the average temperature at the base ranges from almost -30C in August to just a few degrees below freezing in the summer months. Even the warmest temperature recorded at the base was a chilly +6.8C in January 1970. The interior of Antarctica experiences temperatures colder still and while the temperature has dropped as low as -57C at Scott Base, the coldest temperature recorded in Antarctica, and in fact the globe, was -89.2C!
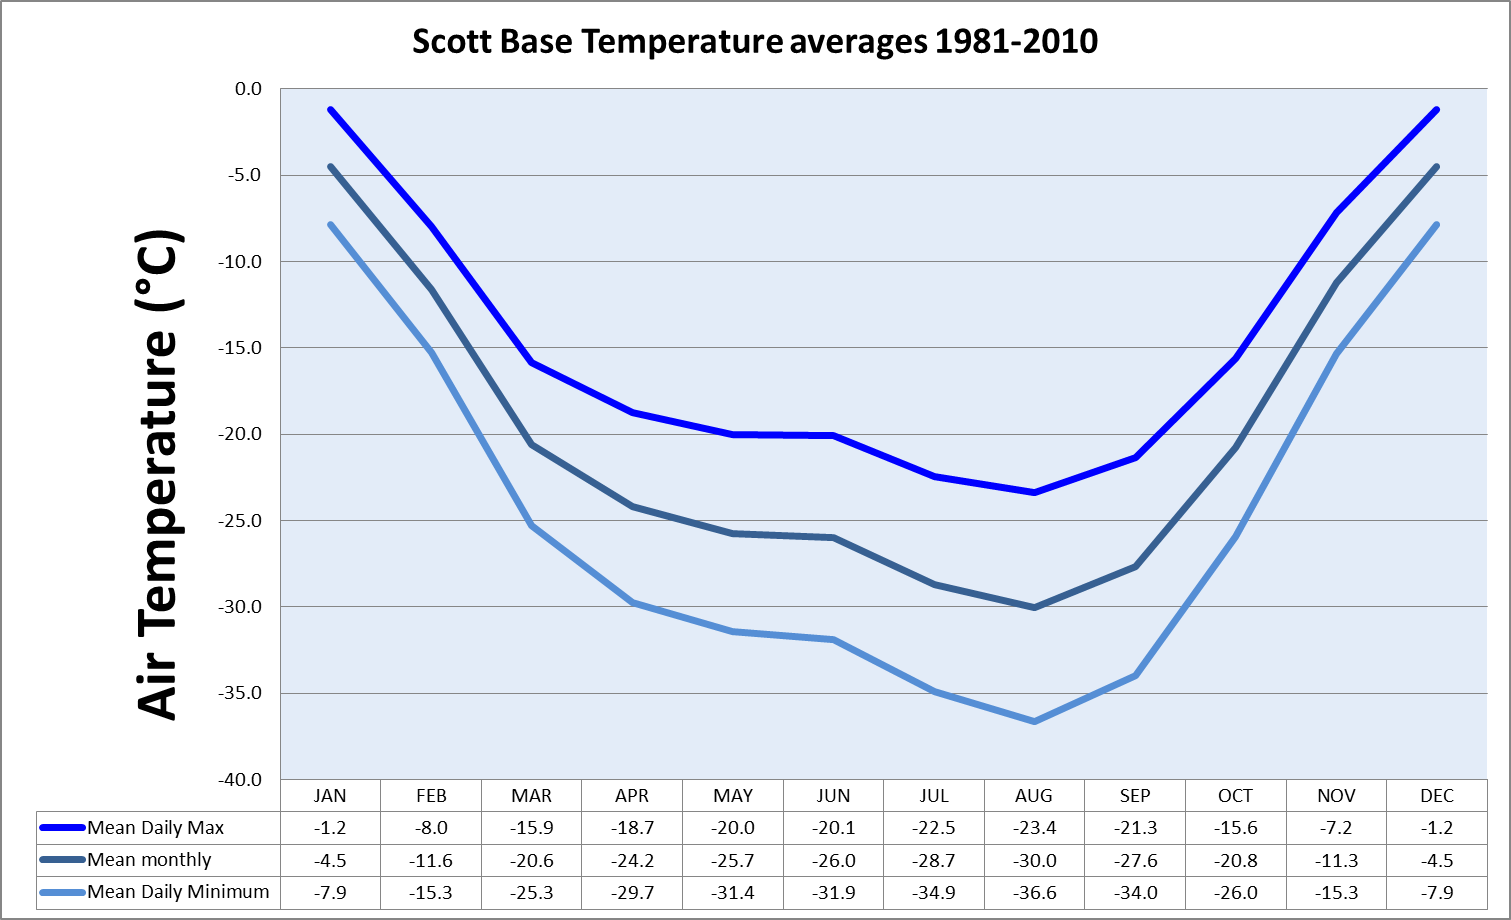 Average Temperature at Scott Base. Data courtesy of NIWA - http://www.niwa.co.nz/education-and-training/schools/resources/climate
You can check out the current conditions at Scott Base on Antarctica New Zealand's website here: http://antarcticanz.govt.nz/scott-base/current-conditions As well as the cold temperatures, the continent is battered by strong winds and gales. On average there are 27 days a year when the mean wind speed exceeds 63km/h ... making it even windier than Wellington (22 days a year)!
Layers
Like onions, the Antarctic wardrobe is made up of layers. You may have seen the clothing layers suggestion on the Towns & Cities pages on metservice.com. These figures are based on a calculation that takes into account not only the temperature but also the wind speed. A temperature of -5C feels much colder when accompanied by gale force winds than under calm conditions.
To learn more about the 'feels-like' temperature and the layers of clothing calculations, check out this blog post: Feels Like. Rather than using one really thick layer, the combination of several layers traps extra layers of air between them acting as further insulation and keeping you toasty warm beneath them.
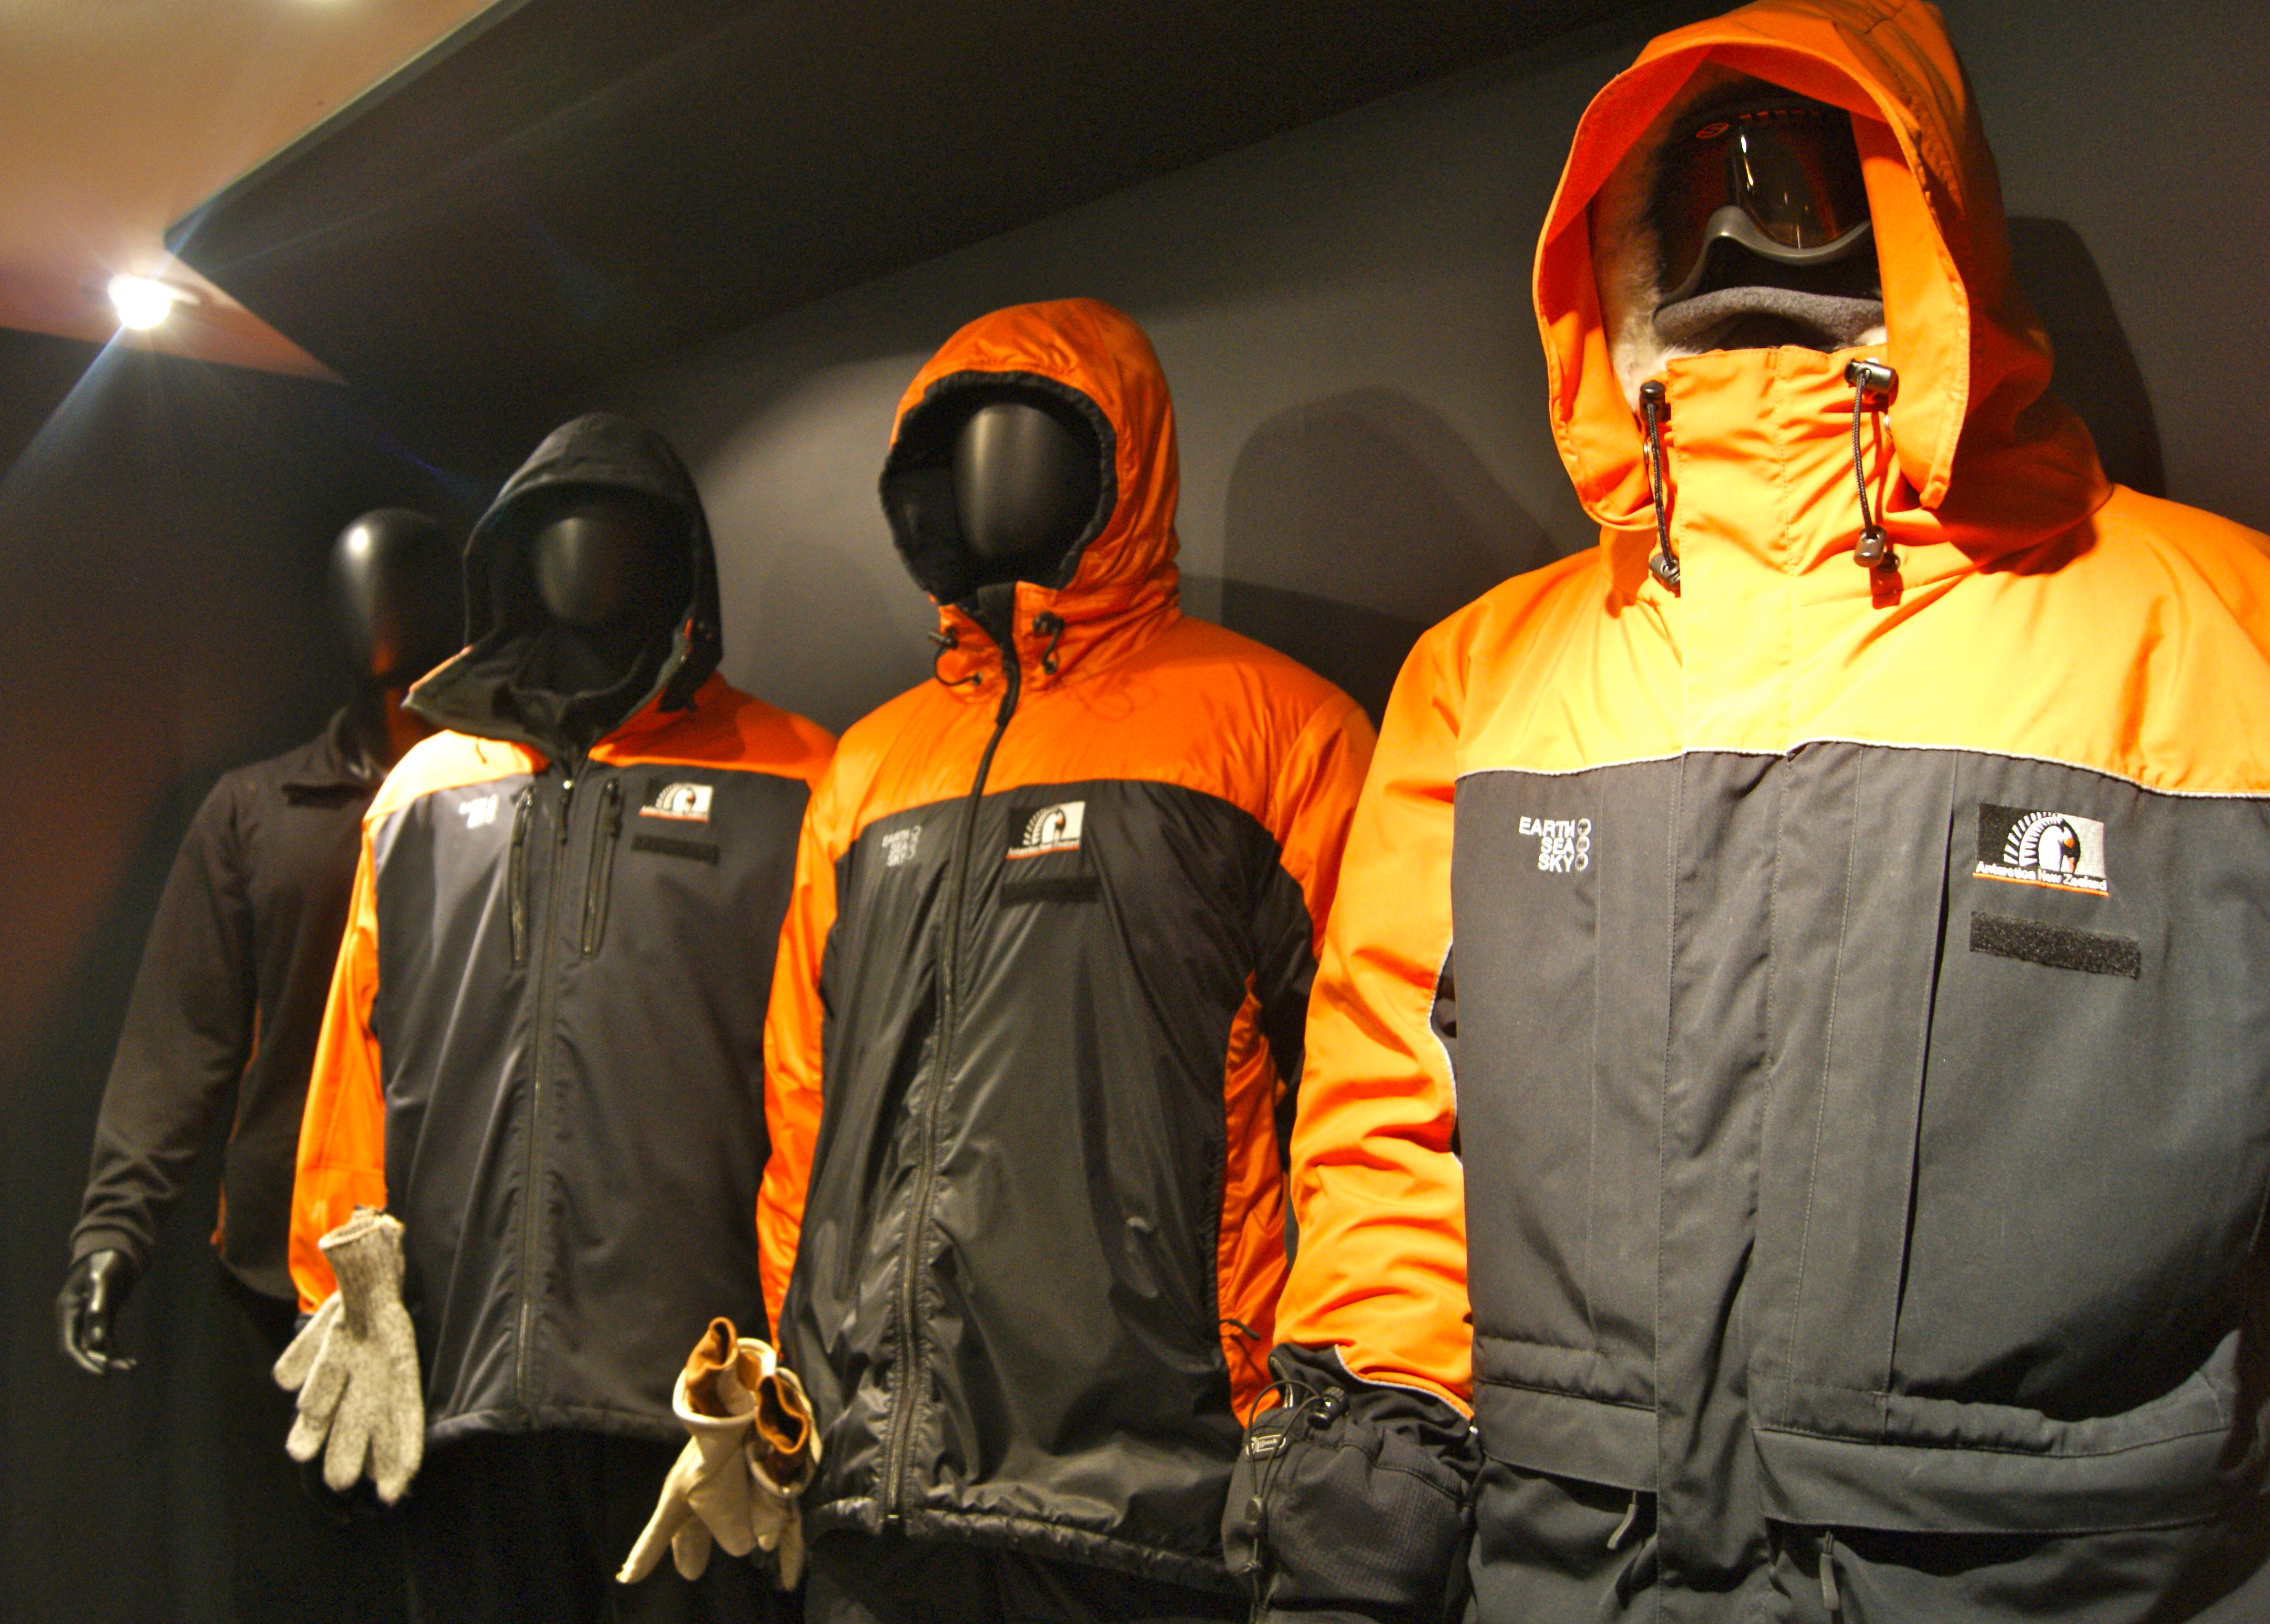 Some of the layers of polar wear on display at the Antarctic centre in Christchurch.
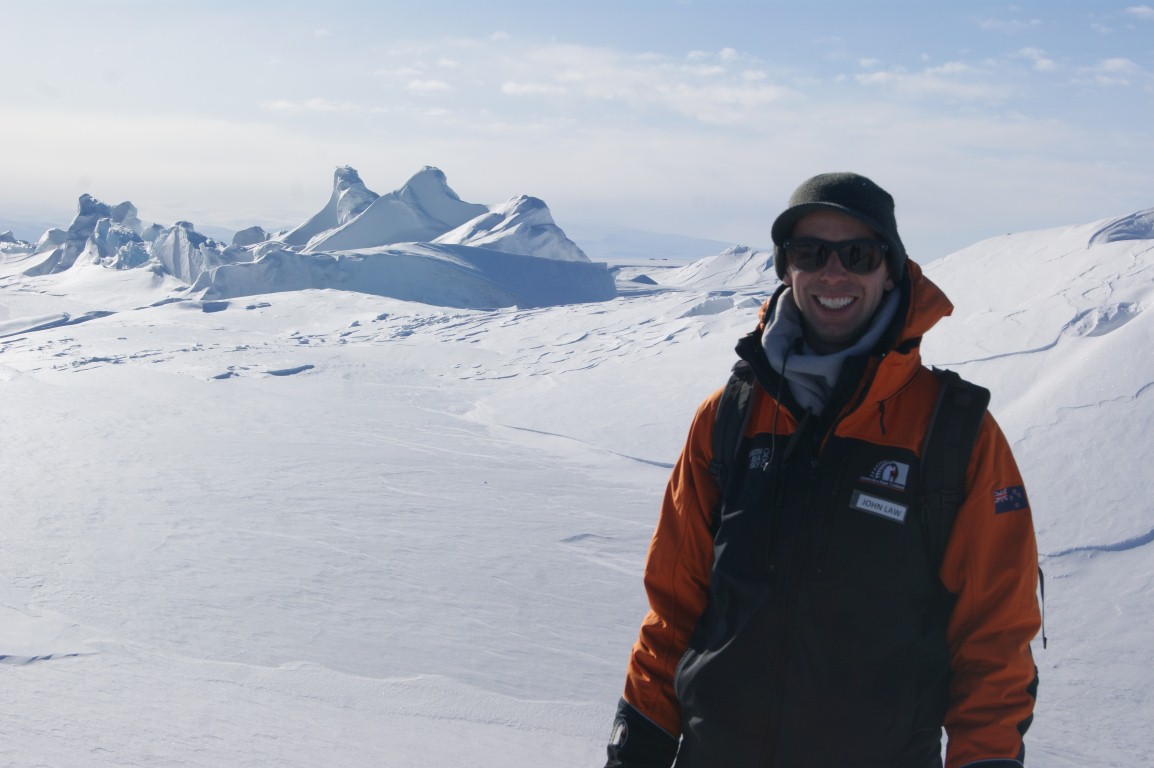
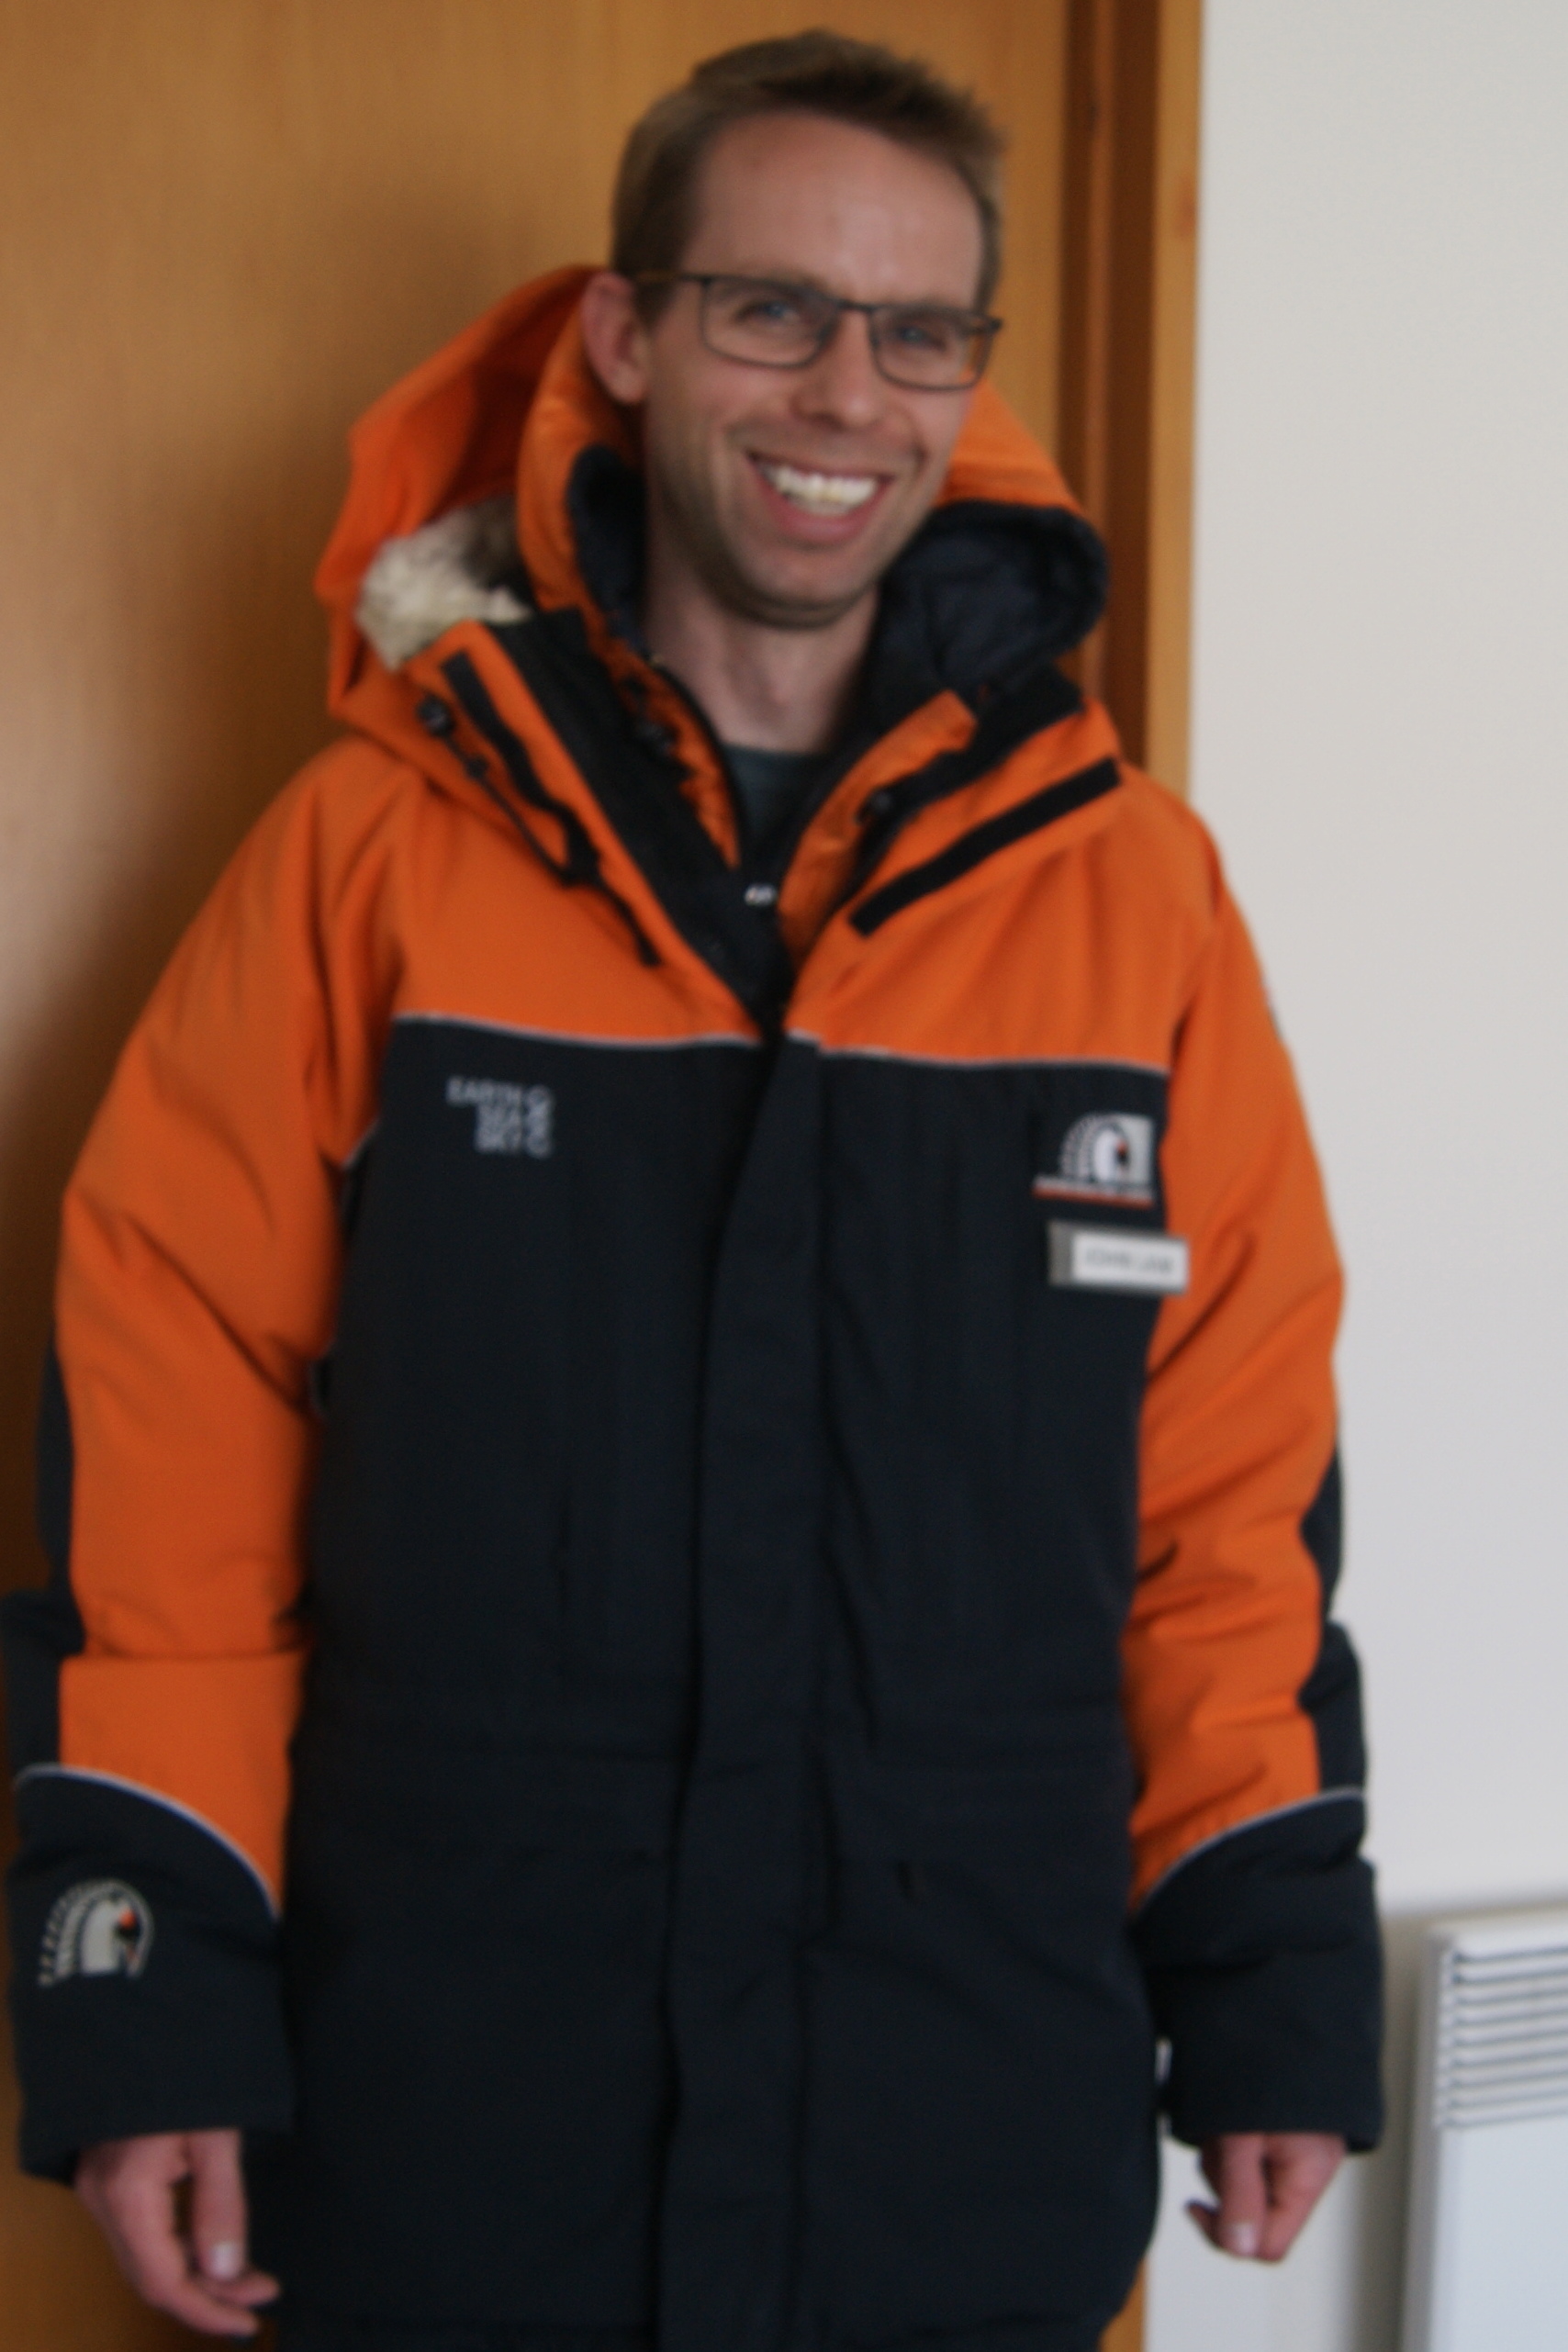 MetService Meteorologist John Law in his Extreme Cold Weather (ECW) gear ahead of departure to Scott Base.