New Zealand is great for outdoor sports. Sometimes the weather is too. With summer approaching and long weekends on the calendar, the time is ripe for packing cars and heading off into the great outdoors. But how do you know if the weather is going to be any good when you’re planning a trip, particularly to places ‘off the beaten track’? This blog post is about how you can get a better idea of the weather in areas not covered by regular forecasts - the types of areas frequented by rock climbers, mountain bikers, kayakers etc.
Know what information is available There is a huge amount of weather information available. The best approach is to use several pieces in combination rather than relying on just one. The types of information are:
-
Point forecasts. Forecasts for a specific location, e.g. a city centre, a mountain hut, an airport etc. Examples are MetService Town and City forecasts and the new mountain forecasts.
-
Area forecasts. Forecasts for a region, which try to encompass the fact that there will be spatial variation while keeping brief enough to be memorable. Area forecasts require a good deal of judgement of what is most important, so are seldom automated. The MetService Severe Weather Watches and Warnings are area forecasts, as are MetService rural forecasts. On the rural page you will find an area forecast, but also point forecasts for specific locations within that area. Figure 1 shows the regions covered in each MetService rural forecast, and figure 2 shows the area and point forecasts on the rural page.
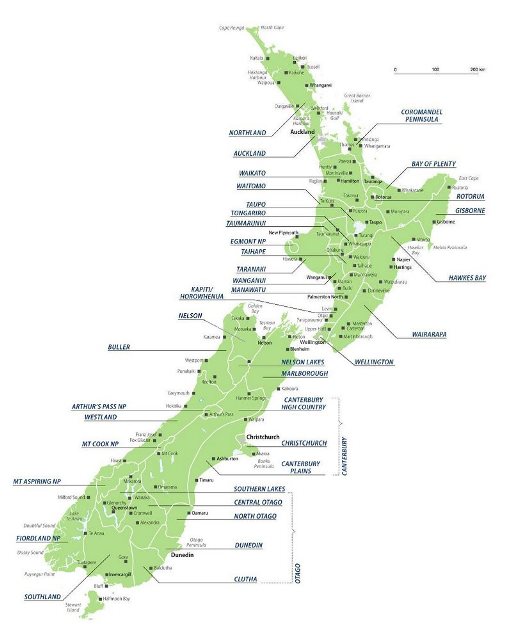 Figure 1: Areas covered in each MetService rural forecast
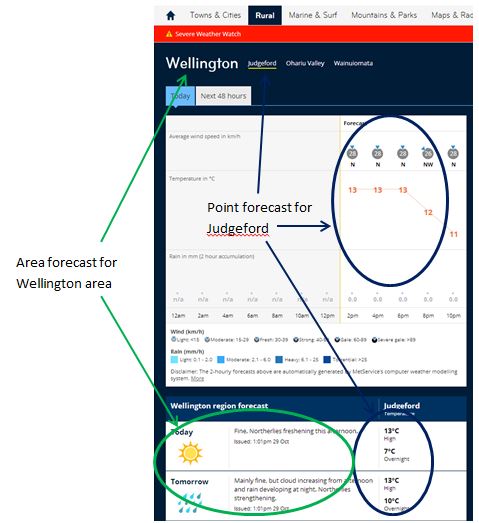 Figure 2: Point and area forecasts on the rural tab of metservice.com
-
Weather maps. These are maps that show some aspect of the weather such as rainfall or surface temperature mapped across a geographic area – where every point on the map has an individual value. Surface pressure maps similarly have a pressure value for every location, but represent this with contours of constant pressure instead of shading. A map with weather symbols representing major towns and cities only has values at irregularly spaced points, so isn’t included in this definition. Examples of weather maps are the 3 and 5 day Rain Forecasts and the surface pressure map found under the 'Maps & Radars' tab on metservice.com
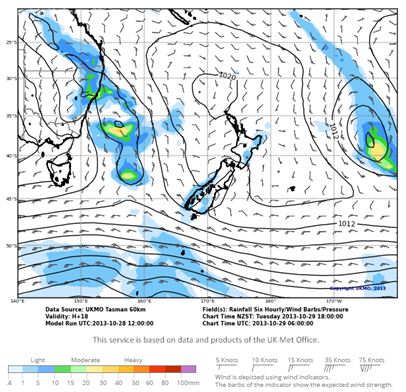 Figure 3: Weather map showing pressure isobars, rainfall and surface winds from metservice.com
-
Observations. This is what is happening now. Observations include looking at the sky, or going online to find the rain radar, satellite imagery or readouts from the many weather stations up and down the country.
-
Local weather knowledge. Nothing beats experience, and if you can match patterns you see at the local scale to the big picture you see in the forecasts, you are in the best possible position to plan your outside activities.
Know what information is good for what
-
Point forecasts are designed to be good for that exact location. We are all familiar with how the weather may be different a short distance away, so if you are not going to be at the exact location of the forecast, you should factor that in. Point forecasts are the most common type of forecast because they can be automatically derived from computer models (such as the model data on the rural page). The most accurate point forecasts (e.g. MetService urban forecasts) are manually created by looking at several models (as well as other information) to determine which best describe what is currently happening and make sense into the future.
-
Area forecasts try and give a general impression of the area, but when the weather is complicated they will focus on the most significant weather in the most important areas (often where most people live). For example, you may see a sun symbol with ‘Fine weather’ for a city forecast, but the rain symbol and ‘Mainly fine but with patchy rain about the ranges’ or similar in the rural forecast. This is not an error, but reflects the different scope of the two forecasts. Likewise, the model data on the rural page may reflect a different story in its own location too, but bear in mind it is based on one model while the area forecast is based on several. If you are heading away from the city and only look at one thing beforehand, read the text on the relevant rural forecast (don’t just look at the symbol!) and check any relevant Severe Weather Warnings and Watches.
-
Most weather maps available online are direct outputs from computer weather models, except for surface pressure charts which are manually adapted to match observations. Maps show a lot of information in a small space, and are key to understanding how the weather will unfold over time and over an area. Meteorologists look at a lot of maps! But forecast maps are always dependent on the limitations of the model that produced them.
-
Observations are the best way to find out what is happening now, but don’t tell you much about the future. However they can be really useful for checking the accuracy of forecasts and choosing which to use.
Models and maps So, you are heading away to somewhere for which there are no point forecasts. The rural area forecast gives you a good impression of what to expect but weather is crucial to your sport and you want more information. If this is you, then you need to get acquainted with maps.
The most common weather map online is one showing rainfall, and several versions are available. So what’s the difference? Maps come from models, which can be described in terms of their resolution – the smallest ‘block’ of atmosphere of land that can be individually treated by the model. A high resolution (small block size) is better in the mountains, but for large flat plains a lower resolution is fine, and may be easier to understand as it has less detail.
Rainfall – and weather in general - is affected by many processes, some the size of a continent and some the size of a small hill. If you look at the small print under the 5 day rain forecast in figure 3 you will see it says “Data Source: UKMO Tasman 60km”. This means the resolution of the model that makes this map is 60 km, so it is great for dealing with large processes more than 120 km in size, but cannot deal with effects smaller than that – such as sheltering behind a small hill or range.
The model behind the MetService 3 Day Rain Forecast has a resolution down to 8 km, so should give a better representation of these smaller effects. Other models available are the GFS model, which has a resolution of about 60 km at New Zealand latitudes, and the 16 km resolution ECMWF model. Another useful data source is the surface pressure map. This shows the larger weather processes at play, which explain a significant proportion of the weather.
There are many good guides to reading surface pressure maps, but some short pointers will suffice here. The wind runs close to parallel to the isobars, with a tendency towards lower pressures that increases over land and more so over mountains. Closer isobars mean stronger winds. Fronts can mean bands of cloud and rain, and if a front is heading your way it is worth looking at the radar to see if it is producing rain. Then look at the rain model data and see if it matches the radar and the marked front on the pressure map. If all three are consistent then you should have better confidence in the model. Not all rain is due to fronts, but comparing the pressure map, model data and radar observations is a good start to understanding where the rain is coming from. For more on rain see the Rain or Showers blog post.
Finally, it is worth knowing the topography of your area. Hills and mountains can modify the weather on scales below that of even the finest models. Topography maps are available online, such as www.topomap.co.nz with 250m and 50m topographical maps for the whole country. Using the surface pressure map or reading the wind barbs in model data (e.g. figure 3) you can find out the wind direction, and whether you will be on the lee side or windward side of the mountains. Often areas on the lee side will get less rain than areas on the windward side, but not always!
Other factors also come into play, but there will often be clues in the area forecasts. If the area forecast has rain about the ranges, and you will be on the leeward side, you could expect less rain. If the area forecast has widespread rain then you would know the mountain wasn’t going to help much. Using forecasts in combination like this can give much better results than one in isolation. Similarly, if your area is near the coast reading the marine forecast for that area will give you more details of when winds will rise, fall and change direction, but bear in mind that winds are normally stronger over sea and on land you will be more sheltered in some directions than others.
Holding several forecasts, radar, maps and topography all in your head at the same time takes practice. If you are returning to the same place regularly it is worth making some notes, and then comparing them against what actually happened. You can also ask locals what their experience is. This way you’ll build up an understanding of the area, won’t have to cancel holidays just because you saw a rain symbol in the forecast, and increase your chances of long weekends in the sun. And whether you’re railing a turn on the Moerangi track in the Whirinaki, crimping a hold out at Wharepapa, dropping the Tutea Falls on the Kaituna river, or paddling lazily down the Whanganui river, you'll be set to have a great time.
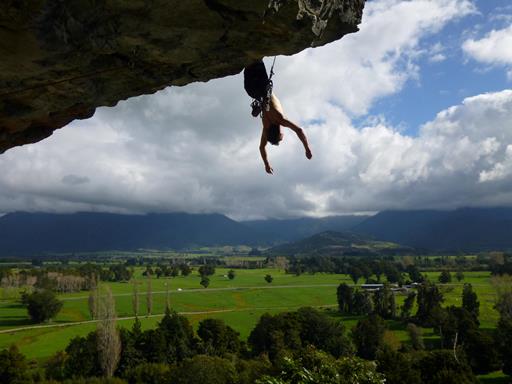 The author getting the weather right on 1080 and the letter G, Paynes Ford, Takaka, photo courtesy of Jeannie Oliver