This article was written in November 2015 and relates to the El Niño conditions at that time
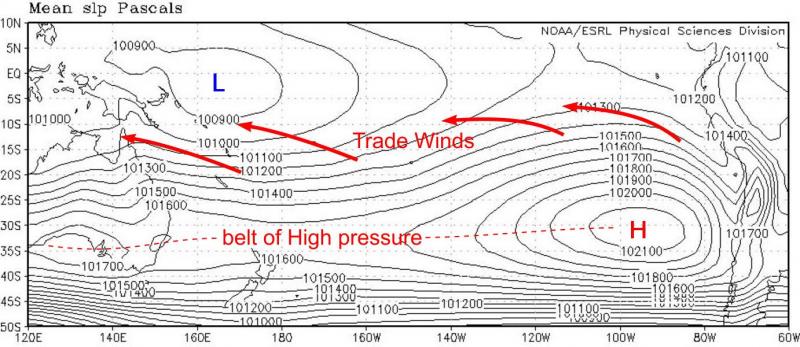
There’s been a lot in the news in recent months (2015) about El Niño. See an ABC news story. Here’s a ‘back-to-basics’ description of El Niño. To start, the chart below shows a climatological average of air pressure at Mean Sea Level over the central and South Pacific. The chart is like isobars on an ordinary weather map, but instead of looking at a single time such as midday today or midnight last night, we’re averaging over a long duration – I’ve chosen 20 years.
 (Image courtesy U.S National Oceanic & Atmospheric Administration Earth System Research Laboratory)
Sea level pressure averaged over 18 October 1995 to 18 October 2015 (contours in Pa rather than hPa, so 102200 Pa = 1022 hPa). The spacing between the isobars is 1 hPa.
In the chart we see a belt of high pressure along latitude 30 to 35S, an area of high pressure off the west coast of South America and relatively low pressure off Papua New Guinea. This is the average, or ‘background’ state of the atmosphere, if you like. This configuration of isobars drives a regime of persistent winds from the southeast direction in the Southern Hemisphere – these low-level winds are called the Trade Winds, named because of their historical importance to trading between continents. In the discussion below I refer to easterly Trade Winds.
The Trade Winds in the southern hemisphere are southeasterly winds and, in the northern hemisphere, northeasterly winds. But for the purpose of this explanation, we’re more interested in the east–west components, so I’ll leave out the north–south part in this discussion. I’m also going to mention the thermocline. This is a layer in the ocean with a rapid temperature drop as you go down through it. The depth of the thermocline varies, but typically it’s a few hundred metres down below the ocean surface. (The thermocline is a bit like an oceanic version of a temperature inversion in the atmosphere.)
The 'Neutral phase' Under ‘normal’ conditions, neither one extreme nor the other, we have a situation referred to as a Neutral phase. Low-level easterly Trade Winds (blowing from east to west) push the warm surface water away from South America towards tropical South-East Asia.
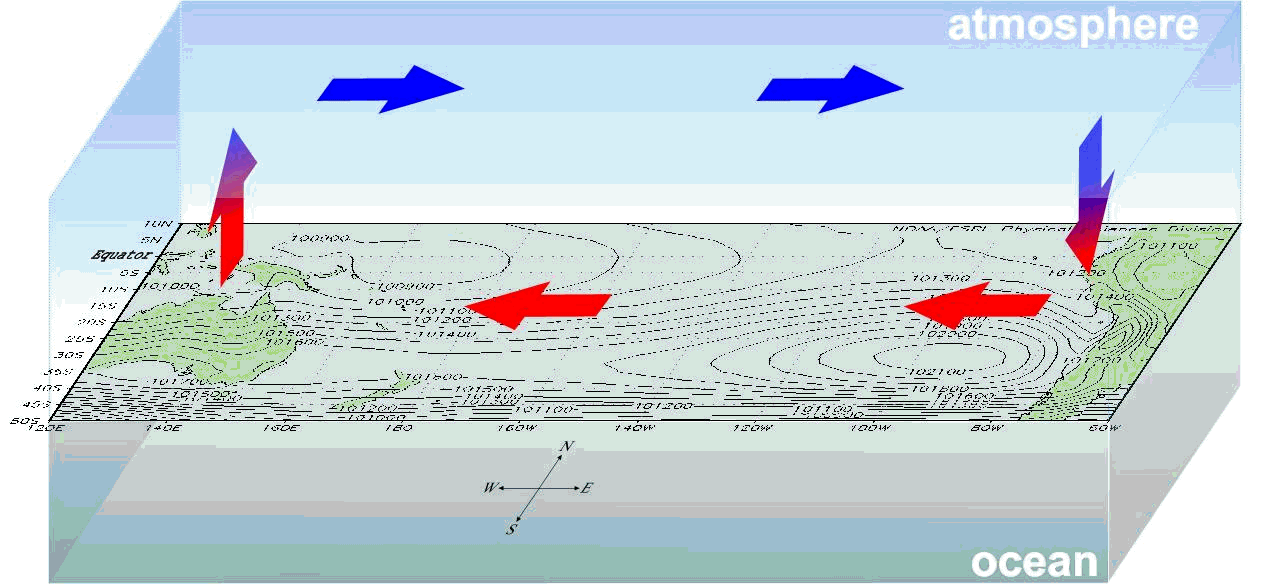 Trade Winds blowing from east to west at low-levels, and a return flow at upper levels.
Around tropical South-East Asia the top layer of ocean water is deeper because the warm water has piled up there (see the cross-section below). Conversely, on the other side of the Pacific, off the west coast of South America the depth of the warm equatorial top layer of the ocean has reduced, and the thermocline is nearer the ocean surface. This means that cold, nutrient-rich water has welled up into the upper parts of the ocean.
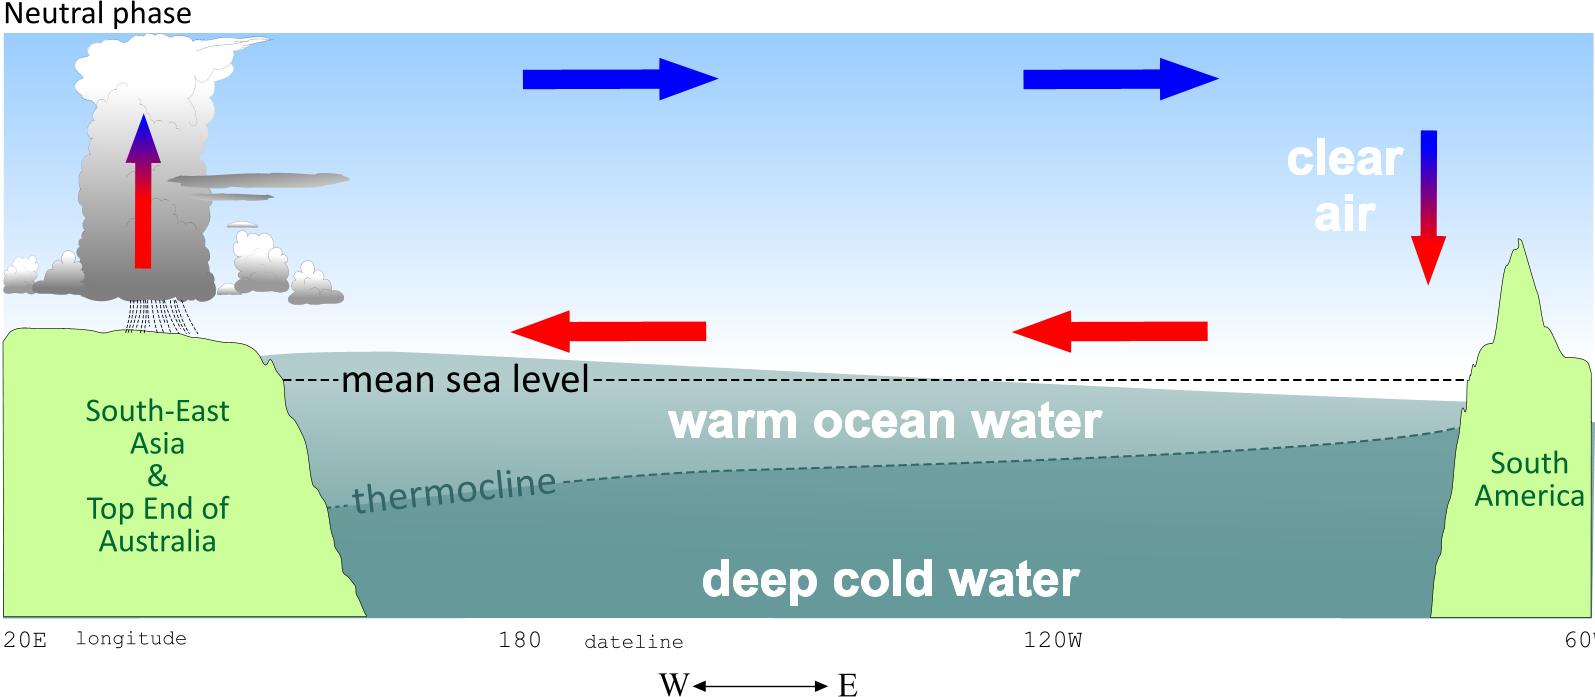 Schematic cross-section of the Neutral phase. For the purpose of illustration, the vertical scale is much exaggerated.
Around tropical South-East Asia, warm surface water evaporates into the air, and the air gets very moist. The moisture-laden air drives increased rainfall around Indonesia and neighbouring lands such as the Top End of Australia. In contrast, over the eastern tropical Pacific and off the coast of Peru, dry air accompanied with cloud dissipation sinks, resulting in much drier weather there.
El Niño phase. The Trade Winds lose most of their strength in an El Niño phase, and may even reverse into a westerly wind (west to east) direction. As a result, warm surface water flows from tropical South-East Asia along an equatorial corridor towards the coast of South America, where it increases the depth of the warm top layer of the ocean.
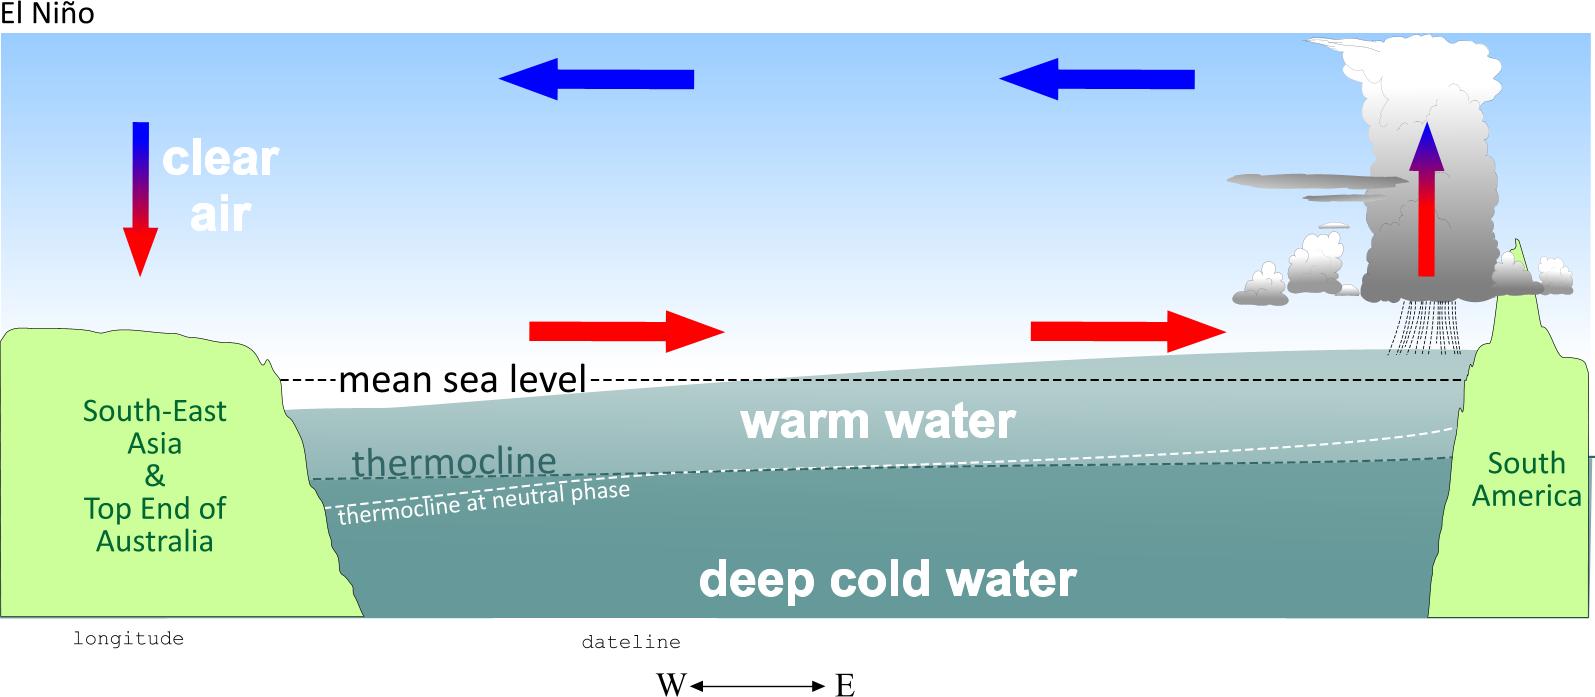 Schematic cross-section of the El Niño phase
Off the coast of South America, the thermocline sinks. The cold deep water no longer wells up into the surface layer of the ocean. The source of nutrients is cut off, which has a subsequent effect on fishing stocks off South America. Nearby, over the eastern tropical Pacific, warm surface water evaporates. This moistens the air, driving more rainfall than usual there. Conversely, on the other side of the Pacific, Indonesia and neighbouring countries are drier than usual during an El Niño.
Why is El Niño given this name? If you know some Spanish, you’ll be aware that it means “the boy”. Early sailors off the coast of Peru noticed that the sea usually got warmer from about Christmas time, and they named this annual warming "the Christ child" or, in Spanish, El Niño. But sometimes the warming was more marked, coinciding with a poor local fishing season - and the term El Niño began to be used only for these events. During periods of cooling, the opposite to El Niño occurred. In latter years, the term "the girl" or La Niña has been used. The oscillation we get from one extreme to the other is simply called the El Niño-Southern Oscillation, or ENSO for short.
The ENSO is a powerful interaction between the oceanic and atmospheric systems, that exerts a strong influence on the weather. Typically, an El Niño (or La Niña) event will develop during the southern winter, intensify during the southern spring, and peak around Christmas. Usually, things weaken off during summer, and often (but not always) there is a return to neutral conditions during the southern autumn. In other words, the typical life cycle of an event lasts around 12 months. However, in some cases, the events will continue through 24 months, with the second phase of the event being weaker.
Earlier in this post we looked at the distribution of air pressure at Mean Sea Level. One way that ENSO is monitored is by measuring air pressure at each side of the Pacific, computing the difference and recording how this difference oscillates. The resulting index is called the Southern Oscillation Index (SOI), and it is most often based on the difference between the air pressures at Tahiti and at Darwin.
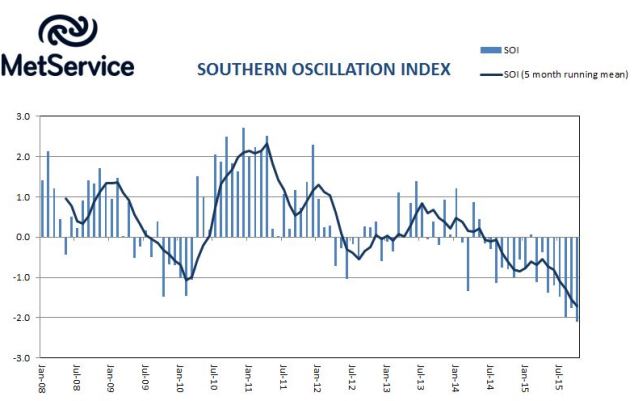 A graph of monthly SOI values between January 2008 and October 2015. Large and sustained negative values denote El Niño conditions.
Another way of monitoring the characteristics and strength of ENSO is by the so-called 'NIÑO' indices. These average sea surface temperatures (actually, their departure from normal) in various boxes along the equator. This is the ‘centre of action’ with respect to abnormal sea temperatures caused by ENSO. 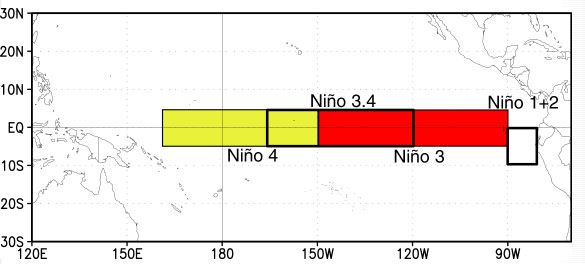
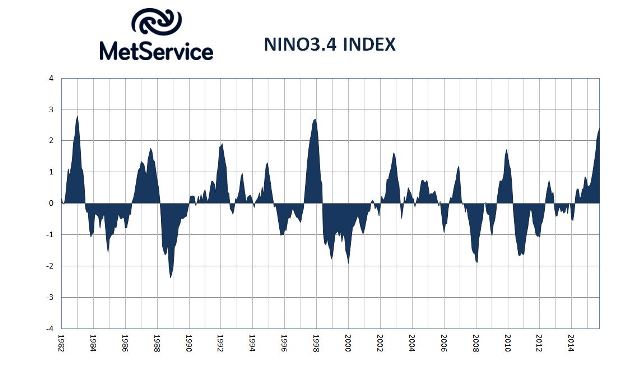 The NIÑO 3.4 index is a measure of how abnormally cold/warm the seas are along the equator, over the central Pacific Ocean (5S to 5N, 170W to 120W). Values from January 1982 to October 2015 are shown. Large positive values denote El Niño conditions.
Looking at the NIÑO 3.4 index, we can see that the 2015 event ranks as the strongest El Niño seen since 1997/98. The El Niño of 1982/83 was also very strong. Because of its scale, ENSO is felt in many parts of the world, including New Zealand.
New Zealand Impacts. Although each El Niño affects New Zealand differently, the general characteristics are:
• More southerly winds in winter (June-August), leading to a cooler than usual winter
• A stormy spring (September – November), with more frequent southwest winds
• For ALL regions of New Zealand, a large increase in the chances of a COLD spring
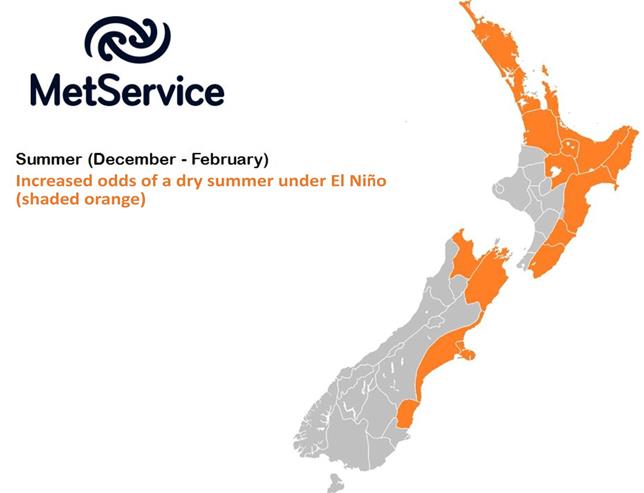
• Winds typically turn westerly in summer (December – February), with an increased risk of dry conditions for eastern regions of both Islands
• Cooler than usual seas around the New Zealand coastline across all seasons 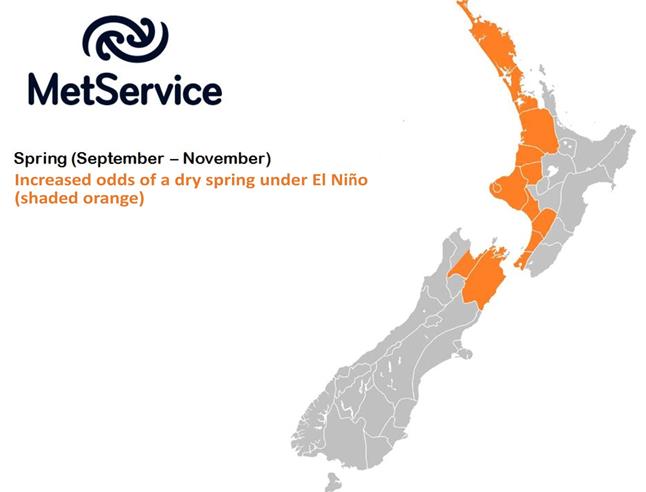
 You can monitor the state of ENSO by following the regular MetService commentary in the monthly outlook or by visiting the Australian Bureau of Meteorology website. This blog was co-authored by Chris Webster and Georgina Griffiths.