MetService.com has a “Feels like” temperature in the Towns and Cities places page at www.metservice.com. This gives, rounded off to the nearest degree, an idea of what sort of temperature the air feels like to a person in the shade. It is an estimate of a sensation, and not an actual temperature.
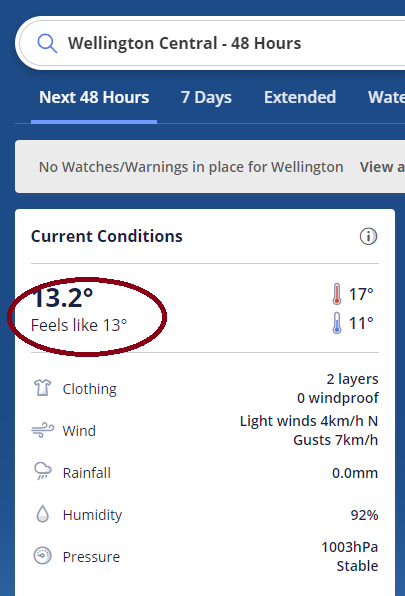
Humans make hopeless thermometers; we are internally heated by our metabolism, and our skin cools in the wind and rain or by perspiring, or it warms in the direct sunshine. When we are outdoors, how warm or cold the air really feels to us is often different from the measured air temperature.
To estimate this “Feels like temperature”, in colder weather MetService calculates a “wind-chill” that accounts for the coolness of the wind as it removes heat from us. In warmer weather we instead calculate an “apparent temperature” that accounts for the sultriness we feel when our perspiration is unable to cool us down efficiently on a warm muggy day. There is a roll-over, between 10ºC and 14ºC, from the wind chill formula to the apparent temperature. These calculations take into account air temperature, wind speed, and humidity: three of the major weather-related variables for chilling and mugginess. Two factors not taken into account are wetness or sunshine, so the “feels like temperature” only applies to dry people in the shade. It's about how the air feels to you. Wetness can matter, because if you get caught in the rain and your skin gets wet, or if you have been swimming on a warm, dry day, cooling of your skin as the water evaporates will increase the cooling power of the wind. But we assume your skin is dry, aside from natural perspiration. Similarly direct sunshine (solar radiation) will make you feel hotter, but this will vary a lot depending on factors such as how sunny it is, the angle of the sun and your skin type. The air temperature is effectively the same in the sunshine and the shade; we assume you are not in direct sunshine. Things such as our physical make-up (age, fitness, height and weight), activity, acclimatisation, mood, alertness, or even when we last slept and ate, all have an impact on how warm or cold we really feel, but are virtually impossible to take into account.
The rest of this post is for those wanting the mathematics of the MetService “Feels Like” formulae.
WIND CHILL
The wind chill formula used by MetService is the one that was adopted internationally after being agreed to by the Northern American Joint Action Group for Thermal indices in 2001. It is based on results of measurements of the loss of heat from the face of human subjects in various air temperatures and wind speeds in a refrigerated wind tunnel, dressed in winter clothing under various types of activity and with both wet and dry faces. For more details on the formula see NOAA Wnd Chill Chart or Environment Canada’s Wind chill pages here and here.
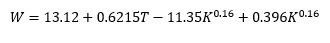
Where W is the wind chill in degrees Celsius, T is the air temperature in degrees Celsius, and K is the average wind speed in km/h at a standard height of 10 metres above ground. Note that wind chill is only defined for K with a minimum speed of 5 km/h, and is only designed for air temperature of 10ºC or less.

Wind chill relates how cool your skin feels in the wind by giving an equivalent temperature out of the wind. For example ….when it is 9ºC and you bike to work doing 20 km/h (down-hill) into a 20 to 30km/h head-wind (total 50 km/h), you’ll lose as much heat as if you were sitting in a fridge (4ºC, circled).
APPARENT TEMPERATURE
There are several indices that take into account the sultriness or mugginess we feel on a hot, humid day. The heat index 2,3 is used most commonly in the USA and is based on work done by Robert Steadman in the 1970s, humidex is used in Canada, and the apparent temperature 4, based on later work done by Steadman as published in 1994, is used in Australia. The non-radiation version of the apparent temperature that MetService uses takes into account air temperature, wind speed and humidity:
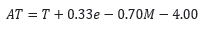
Where AT is the apparent temperature in degrees Celsius, T is the air temperature in degrees Celsius, M is the average wind speed in m/s at standard height of 10 metres above ground, and e is the water vapour pressure (humidity) and can be linked to rh or percent relative humidity using e= rh/100 x 6.105 x exp( 17.27 x T/ (237.7+T)) where exp(x) is short for the exponential function, ex .
Sometimes the apparent temperature comes out less than T. In those cases we take T as the “feels like“ temperature.
ROLL-OVER
The wind-chill formula is designed to be used in cool temperatures of 10ºC or less, but still give some idea of the chilling effect of the wind for temperatures above 10ºC. The wind chill at 12ºC for a wind speed of 5 km/h is exactly the air temperature, so it is logical to take this as the midpoint of a pragmatic roll-over between pure wind chill (up to 10ºC) and apparent temperature (from 14ºC upwards). In the roll-over zone for T from 10ºC to 14ºC, MetService uses a pragmatic linear roll-off of the wind chill, so the “Feels like temperature” is
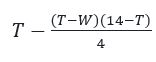
If T is less than 10 then W is the “Feels like” temperature, and if T is more than 14 then either AT or T (whichever is the higher) is the “Feels like” temperature.
LAYERS OF CLOTHING
In 1971 Robert Steadman designed a wind chill index that measured the thickness of clothing required to maintain thermal equilibrium.

Steadman’s Clothing index (1971) gives the thickness of clothing required to maintain thermal equilibrium in a cool wind. It assumes standard wool/cotton clothing covering 85% of the body including a hat and gloves/mittens.
The Clothing index can be a useful reference for comparative purposes. Assuming each layer of clothing is a couple of millimetres thick, the colour-coding in the accompanying table shows how many layers of clothing are required (orange =1, etc). As can be seen in comparison with the wind chill table, they both slope in much the same way. However the clothing requirement index changes very slowly for above-zero temperatures (left side of table) and then changes very quickly for below zero temperatures (right side of table). This is correct: we need thicker clothing more rapidly as the temperature drops below zero. And note that in the interests of modesty we assume you always need at least one layer of clothing even when it is very hot. :-)
References:
Osczevski, Randall and Maurice Bluestein 2005: The New Wind Chill Equivalent Temperature Chart. Bulletin of the American Meteorological Society, Oct. 2005, p. 1453–1458. 2.
The Assessment of Sultriness. Part I: A Temperature-Humidity Index Based on Human Physiology and Clothing Science, R. G. Steadman, Journal of Applied Meteorology, July 1979, Vol 18 No7, pp861-873 3.
The Assessment of Sultriness. Part II: Effects of Wind, Extra Radiation and Barometric Pressure on Apparent Temperature Journal of Applied Meteorology, R. G. Steadman, July 1979, Vol 18 No7, pp874-885 4. Robert G. Steadman. 1994
Norms of apparent temperature in Australia. Aust. Met. Mag., Vol 43, 1-16. 5. Steadman, R.G., 1971: Indices of Wind chill of Clothed Persons’, Journal of Applied Meteorology, Aug 1971, Vol 10, p674-683