Here is an explainer on the difference between the rain radar imagery and rain forecast imagery available on metservice.com and how to use them.
Rain radar
Below is a rain radar image for all of New Zealand. You can find the latest image here: Rain radar The rain radar shows the rain in real-time over New Zealand. You can use it to see how much rain is currently falling and has recently fallen. By watching the real-time movement of the rain, you can estimate where the rain is likely to go to next and how quickly. For more details on how to interpret the radar see our blog post, Flying Under the Radar.
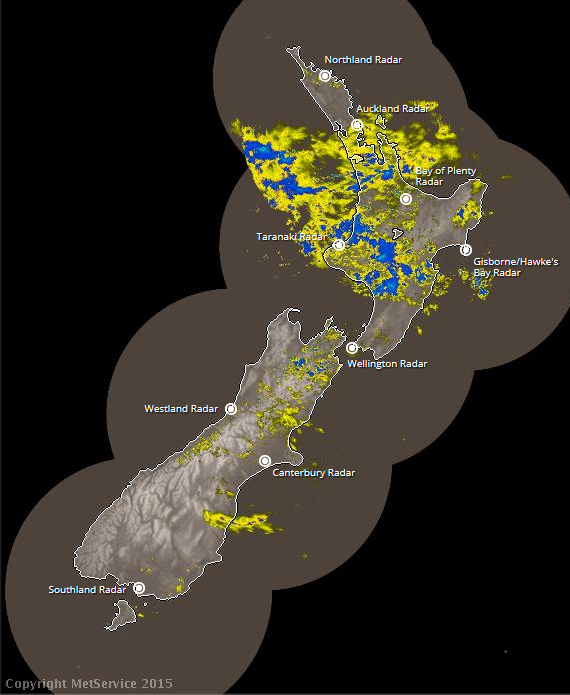
MetService rain radar image showing rain over New Zealand at 2.58pm on Sunday 15 November 2015
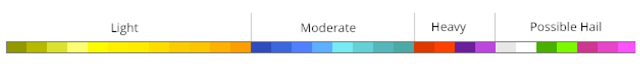
This key shows the intensity of rain (and possible hail) for each colour on the radar above.
Usually you’ll see areas of blue surrounded by yellow – if such an area moves over your location, you’d observe light rain start to fall, become heavier, then ease off again.
Forecast rainfall – local area models
In contrast to imagery from the rain radar, the chart below shows the rain forecast by one of our local area computer models. We choose to display whichever model is representing the weather most accurately on that day. You can find the latest chart here: 3 day rain forecast This is not showing actual rainfall – it is forecast rainfall. You can use it to see how much rainfall is likely to fall in your particular location over the next three days.
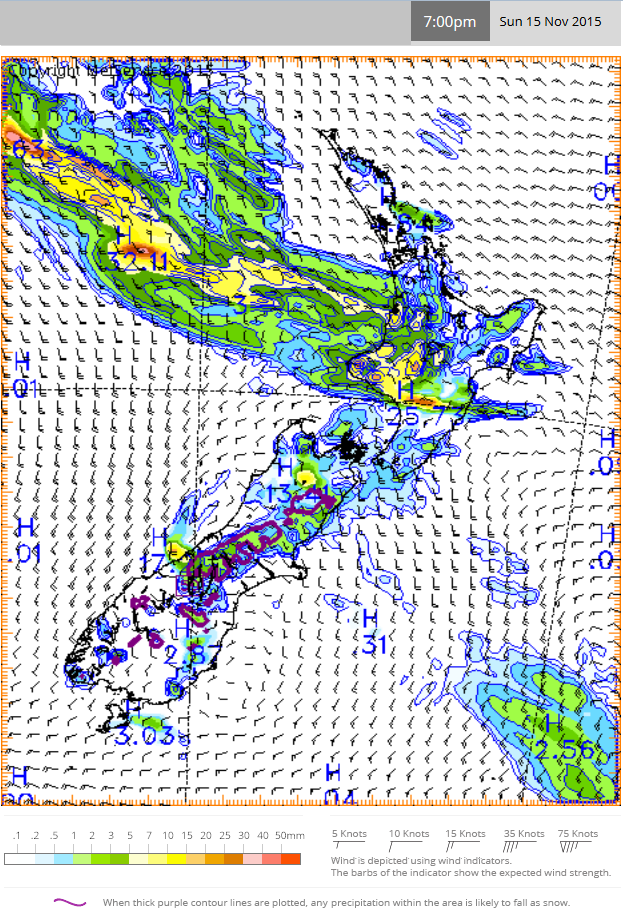
MetService computer-generated rain model showing the amount of rain forecast to fall in the three hours from 4pm to 7pm on Sunday 15 November 2015
The key showing the estimated rain (in mm) for each colour is shown at the bottom left of the chart. The amount of rain is over a three hour period (not just for that hour). For example, this chart shows that in eastern Bay of Plenty the model is forecasting a total of 2-3 mm will fall (mid-green) in the three hours from 4pm to 7pm. Wind barbs (see the key at the bottom right of the chart) at sea level are overlaid on this chart.
Forecast rainfall – global models
The chart below also shows forecast rain. This time it is from the UK Met Office model that covers the globe. You can find the latest chart here: 5 day rain forecast. Again, this is not showing actual rainfall – it is forecast rainfall. You can use it to see the location and amount of rainfall likely over a longer time period (up to 5-days) and, because it comes from a global model, gives a wider view of what is going on around New Zealand (i.e. what is waiting in the wings).
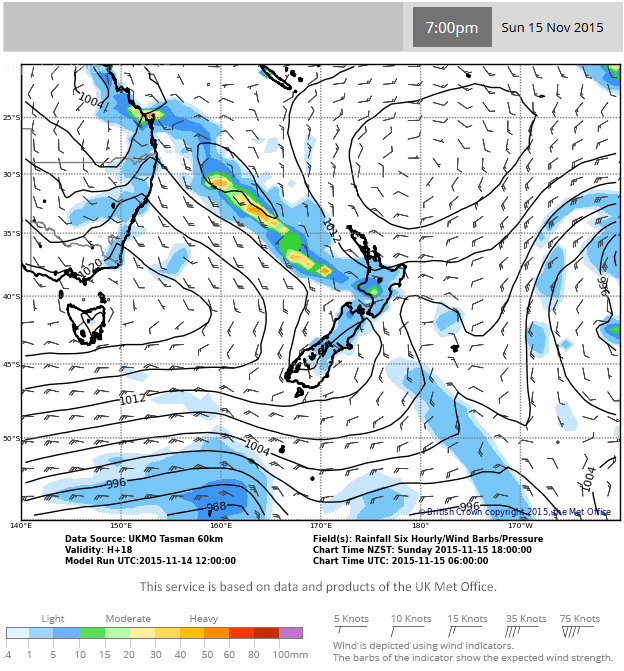
MetService rain model showing the amount of rain forecast to fall in the six hours from 7am to 7pm on Sunday 15 November 2015
The key showing the amount of rain (in mm) for each colour is shown at the bottom left of the chart. Note that this key is different to the key for the local model image – the colours represent different amounts of rainfall. Again, this chart shows the amount of rain forecast to accumulate over a number of hours. The global model chart has time steps of three hours for the first 48 hours, and then has time steps of 6 hours after that (this is clearer if you go to the website, scroll through and look at the time steps at the top of the chart). For example, the chart above shows the total amount of rain forecast to fall in the six hours between 1pm and 7pm. Wind barbs (see the key at the bottom right of the chart) and isobars (lines of equal pressure) at sea level are overlaid on this chart.
It is worth noting that the rain forecast data discussed above come from just one or two models. The written forecasts and warnings produced by our meteorologists are a result of analysing a larger number of models, which can sometimes be quite different to each other (especially for longer lead times). So while the rain forecast data on our website is a useful tool for you to use, it is made more powerful if you combine it with the information contained in our written forecasts and warnings.