Written by Chris Webster Metservice Meteorologist
The hectoPascal and Air Pressure In meteorology, the quantity pressure is an important driver of physical processes in the atmosphere. Pressure is the force applied over a unit of area, so it can be increased by having more force acting over a smaller area. Pressure is measured in Pascals, named after the French mathematician and physicist Blaise Pascal (who also devised the famous “Pascal’s triangle”). The abbreviation for Pascal is Pa. An example of where air has high pressure is the inside of an inflated tyre. For typical values of air pressure in a tyre, it’s best to measure pressure in units of kilopascals (kPa, thousands of Pascals). But for the range of air pressures that occur naturally in the atmosphere we normally use hectoPascals (hPa, hundreds of Pascals) rather than kPa. At the Earth’s surface the air pressure of the atmosphere is usually within the range 980 to 1030 hPa. The hectoPascal is the modern replacement unit for the millibar:
one hPa = one millibar = one thousandth of a “bar”.
The millibar was introduced by the British meteorologist Sir Napier Shaw in the early 1900s. Shaw also created an important thermodynamic diagram that is still used extensively today in modern meteorological services worldwide. In 1930 Shaw sent his Christmas greetings to the then director of the NZ Meteorological Service, Dr Edward Kidson. A copy of the card is reproduced below.
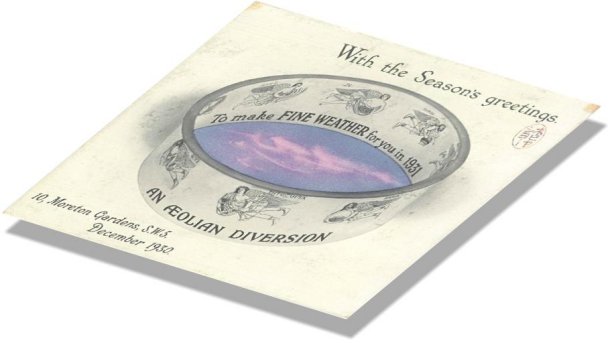 Card from Sir Napier Shaw to Dr Edward Kidson, NZ Meteorological Service, 1930
The text on the reverse side read as follows: Dear Kidson
This is in illustration of a new view (so far as I am concerned) of the relation between velocity and pressure gradient namely that it is the velocity that controls the gradient. If it increases, the gradient will increase so motion round an area means the creation of high pressure over the area. The picture is for the northern hemisphere. What is fine weather for you? Anticyclonic as here, or cyclonic? I have just sent off the last of M.S. for Vol iv : shall have time to write soon.
Sir Napier Shaw
(The reference to "Vol iv" relates to a manual of meteorology that Shaw had been working on for some time. "Aeolian" relates to Aeolus, the Greek god of wind) I can most readily illustrate the importance of air pressure to weather by referring to today’s weather map:
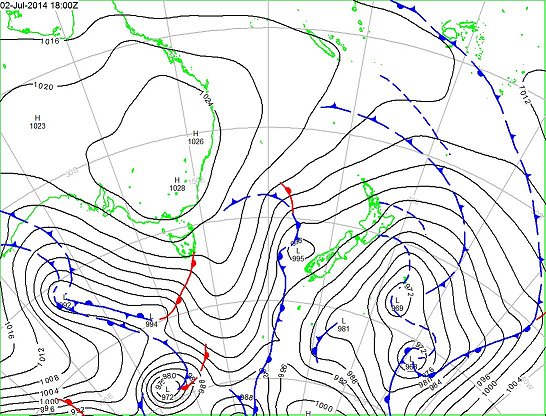 Mean Sea Level analysis, 6am 3 July (18UTC 2 July) 2014
The thin solid lines are isobars, which means lines connecting places with equal air pressure (note the “bar” in “isobar”). These lines give a good idea of what the broad-scale winds are. Let me explain by describing what happens when you release the valve on a tyre. The air ejects from the region of much higher pressure within the tyre to the region of lower air pressure outside the tyre. In the Earth’s atmosphere, when the air accelerates from high to low pressure, the rotation of the Earth deflects the out-flowing air towards the left in our southern hemisphere (the opposite deflection occurs in the northern hemisphere). This is why the air around an anticyclone (High pressure area) rotates anticlockwise in our hemisphere. A previous blog-post describes the anticyclonic outflow of anticyclones, together with the descent that is characteristic of Highs.
At the time of the chart above, NZ was mostly affected by a southwesterly air-stream (i.e. coming from the southwest, and therefore cold). In this chart the spacing between the isobars is 4 hPa. If we remove the fronts from the chart and increase the number of isobars by drawing them at 1 hPa spacing, we get an increased level of detail about the pressure field, as below:
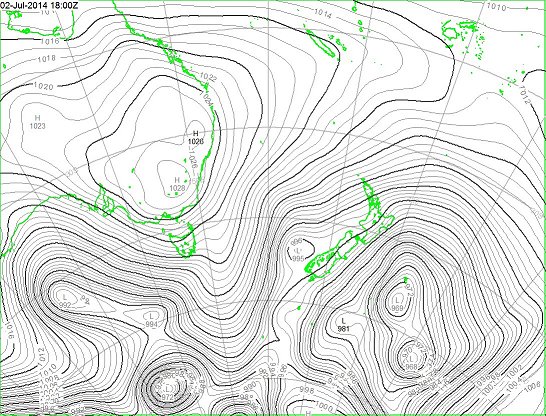 Chart at same time as previous, but fronts removed and intermediate isobars added (in grey)
Note, for example, the extra detail about the structure of the High over New South Wales and Victoria. Thinking about the tyre again, when you initially release the valve the difference in air pressure between each side of the valve is large - the air rushes out with a hiss. If you were to continue deflating the tyre, the difference in air pressure would reduce and the air-flow would become much gentler.
Similarly, in the atmosphere, when the isobars are close together the air rushes out faster and gets deflected more – thus the winds are stronger when the isobars are close together. Less obvious is how air pressure changes as you go up in the atmosphere. For example, if you were flying to Australia the ambient air pressure as you cruised across the Tasman Sea would be about a quarter of what you’d experience at the sea surface. You can read more about these vertical variations at this blog post: Up and Away