New Zealand lies mid-way between the tropics and the Southern Ocean, and our day-to-day weather can arrive from either direction.
On a longer time scale (weeks to months), tropical weather is influenced by the state of the El Nino-Southern Oscillation (ENSO). The ENSO climate pattern affects wind flows, rainfall distribution and sea temperatures right across the tropics, from equatorial South America to Indonesia. It also has some effect on New Zealand’s climate (winds, temperatures and rainfall patterns), although generally to a lesser degree than in the tropics. This is because weather patterns to the south of the country also play their part. And here’s where we introduce the big boy of southern hemisphere climate – the Southern Annular Mode (SAM).
The SAM, as it is commonly known[1], is one of the biggest drivers of southern hemisphere climate variability. The word ‘annular’ means ‘ring-like’, and that is exactly what the SAM does – it controls the ring of westerly winds that circle the South Pole.
The SAM alters the north-south movement of the westerly belt around Antarctica, and this in turn changes the strength of the westerlies over New Zealand, rather like dominoes.
The SAM produces alternating bands of windiness and storminess between the higher latitudes (the Southern Ocean and Antarctica) and the mid-latitudes (e.g. the New Zealand region).
When the SAM is positive, pressures are lower than normal over Antarctica, and westerly winds are stronger than normal over the Southern Ocean. Over New Zealand itself, pressures are higher than usual, particularly over the South Island. Relatively light winds (weaker westerlies) and settled weather prevail over much of New Zealand during the positive phase of the SAM.
Figure 1 shows the variation in pressure, compared to normal, during the positive phase of the SAM.
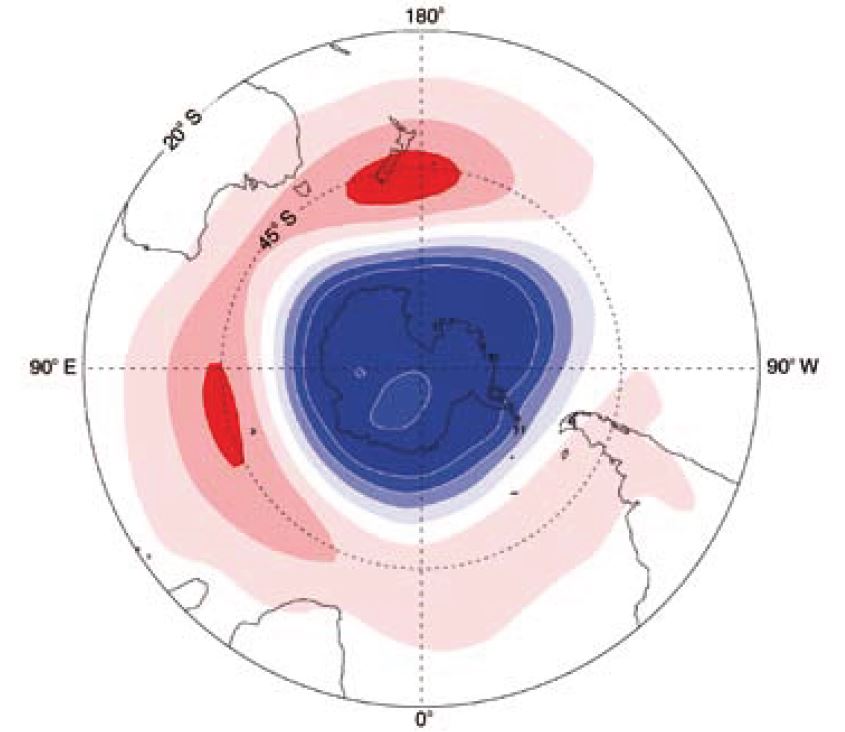 Figure 1: The variation in pressure due to the positive phase of the SAM, with the South Pole in the centre of the image. Red colours indicate higher than usual pressures, blue colours show lower than usual pressures. Directly from Renwick and Thompson, 2006.
In contrast, during the negative phase of the SAM, pressures are higher than usual over Antarctica, and westerly winds are weaker than normal over the Southern Ocean. Lower pressures dominate over the South Island, and stronger, stormy westerlies affect most of New Zealand. We can see evidence of the SAM in New Zealand seasonal rainfall and temperature.
The response in the positive phase is roughly the reverse of that seen in the negative phase. However, the effects do vary by season and by region, and typically the most significant changes occur in western regions of both Islands. It is, on average, warmer and drier than usual during positive phases of the SAM, and wetter and cooler than usual in the negative phase, for western regions of the country. The response in eastern parts of the country is much less clear-cut. Responses tend to be small, or weakly opposite that seen in the west of the country. Some details are given for the positive phase of the SAM in the text below.
The positive phase of the Southern Annular Mode (SAM)
- Ring of westerly winds contracts towards Antarctica.
- Stormy Southern Ocean.
- Higher pressures over the South Island.
- Warmer summer days for western and inland parts of both Islands, also Southland and Otago; cooler summers elsewhere along the eastern coastline of both Islands.
- Warmer winters right across the country.
- Drier than normal summers for western and inland parts of both Islands, also the eastern South Island south of about Banks Peninsula.
- Risk of wetter than usual summers for Northland.
- No clear signal in summer rainfall for Nelson, Marlborough, Bay of Plenty, or the east of the North Island.
- Drier than normal winters for most regions, excepting Westland and Fiordland (wetter), and Nelson, Bay of Plenty, Gisborne and Hawkes Bay (no clear signal or risk wetter).
Recently, a sustained period of negative SAM occurred through November 2014 (Figure 2), while a strongly positive phase was observed in December 2014 and January 2015.
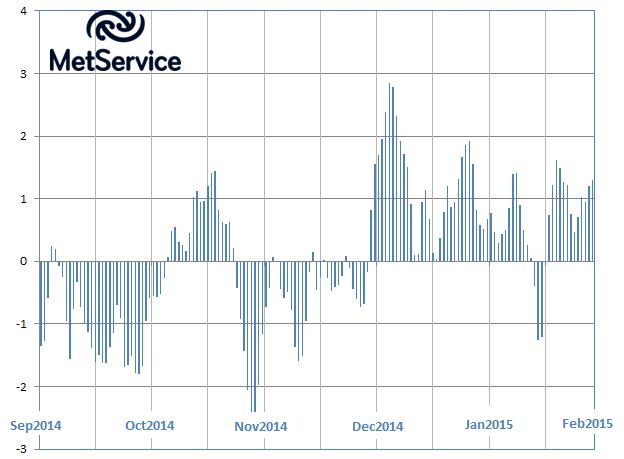 Figure 2: Daily values of the Southern Annular Mode, as observed between 1 September 2014 and 1 February 2015. Note the sustained period of negative SAM in late October and through November 2014, and the strongly positive SAM phase during December 2014 and most of January 2015.
November 2014 is a good example of a month dominated by the negative phase of the SAM. Low pressures sat over and to the east of the South Island (Figure 3), and stormy southwesterlies lashed the country. It was a very cold month across the country, and it was wetter than usual for western areas of the country. Conversely, it was drier than normal for eastern regions.
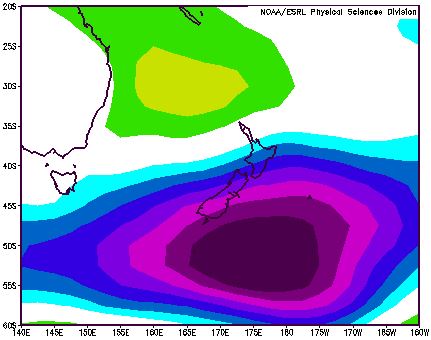 Figure 3: Mean sea level pressure anomaly (variation from normal) for November 2014. Lower pressures are shown in blue or purple colours, higher pressures in yellow or red shades. Image produced using the NOAA/ESRL Physical Sciences Division website http://www.esrl.noaa.gov/psd/
In contrast, higher pressures dominated over the New Zealand region during December 2014, centred southeast of the South Island (Figure 4). Very dry and warm conditions prevailed, consistent with the positive phase of the SAM.
 Figure 4: Mean sea level pressure anomaly (variation from normal) for December 2014. Lower pressures are shown in blue or purple colours, higher pressures in yellow or red shades. Image produced using the NOAA/ESRL Physical Sciences Division website
In conclusion, we know that there are links between the state of the SAM, and monthly or seasonal pressure, rainfall and temperature patterns in the New Zealand region. But can we use it to forecast our likely climate variations over the next few weeks? The answer is ‘almost’. The phase of the SAM can, and does, flip-flop week to week. But usually, once the SAM has changed phase, the phase tends to last several weeks. There are already operational forecasts of the SAM phase in use, which extend out for the next fortnight. Food for thought, then – and certainly part of our toolbox when issuing our 4-week rural forecast
[1] The Southern Annular Mode is also known as the Antarctic Oscillation (AAO). For those wanting a technical definition, the AAO index is constructed by projecting the daily (00 UTC) 700hPa height anomalies poleward of 20°S onto the loading pattern (or leading mode of Empirical Orthogonal Function analysis) of the AAO. References: Ho, M., A.S. Kiem, and D.C. Verdon-Kidd, 2012: The southern annular mode: A comparison of indices. Hydrol. Earth Syst. Sci., 16, 967–982, doi:10.5194/hess-16-967-2012. Kidston, J., Renwick J.A., McGregor J. 2009: Hemispheric-scale seasonality of the Southern Annular Mode and impacts on the climate of New Zealand. Journal of Climate. 22: 4759-4770 Renwick, J.A. and Thompson D. 2006: The Southern Annular Mode and New Zealand climate. Water & Atmosphere 14(2) 2006.