It's been a while since a rapidly-deepening low passed close to, or over, New Zealand. I thought it might be interesting to take a quick look at why the "bomb" low of Saturday 03 March 2012 deepened so quickly and why the winds around it affected the areas they did. First of all, here is a series of weather maps covering the period 1pm Friday 02 March to 1am Sunday 04 March.

Mean sea level analyses from 1pm Friday 02 March 2012 to 1am Sunday 03 March 2012, at six-hourly intervals.
A Bit of Background
Large-scale features on the weather map - that is, those systems which influence the day-to-day weather (highs, lows, fronts) - are driven by processes in the middle and upper parts of the troposphere. Lows become deep and anticyclones become intense when there is strong positive feedback between these processes. In the case of lows, when the intensification (a change in central pressure) exceeds more than a certain amount over a given time, they are defined as "bombs". Actually, it's not quite that simple: if you really want to know more, see "Technical Stuff" at the end of this article. Between 1am Friday 02 March and 1am Saturday 03 March, the central pressure of this particular low fell from 1002 hPa to 975 hPa: it qualifies. The term "weather bomb" has come into popular usage in New Zealand to describe dramatic and/or destructive weather events - but very seldom is a "bomb" low the cause. "Bomb" lows aren't all that common in the New Zealand area.
The Low of Saturday 03 March
Below is the weather map for 1am Saturday 03 March, superimposed on a satellite image. At this stage the low was still west of Taranaki, deepening rapidly and heading more or less straight for Palmerston North (but it never got there). I've drawn in some mauve arrowed lines to indicate the axis of strongest winds in the upper troposphere, known as the jet. The relative locations of the low and the jet, and the shape of the jet, strongly favour further deepening of the low and its movement towards the eastsoutheast - which is what happened. Note: this is a simplified explanation ahead of a bit more case work.

Mean sea level analysis 1am Saturday 03 March 2012, together with infra-red satellite image. Satellite image courtesy Japan Meteorological Agency.
A few hours later, at 6am Saturday 03 March, the low had a central pressure of about 971hPa and was not far south of Patea. Below is a portion of the working chart for 6am, drawn by one of MetService's Severe Weather team. There's a lot of isobars around the low - and over Taranaki, Wellington and the Marlborough Sounds in particular. The closer together the isobars, the stronger the winds. Also note that there's a front drawn curling around the low. Tucked in on the southern and western side of this front is a zone of very strong winds, shown by the blue arrow. It's mostly this zone which did the damage as it moved across the southern part of the North Island.

Hand-drawn mean sea level analysis for 6am Saturday 03 March 2012. This is an internal working chart, drawn by a member of MetService's Severe Weather team. Image copyright Meteorological Service of New Zealand Limited 2012.
Some Interesting Observations
At Hawera, the wind increased quickly during the early morning hours of Saturday 03 March.
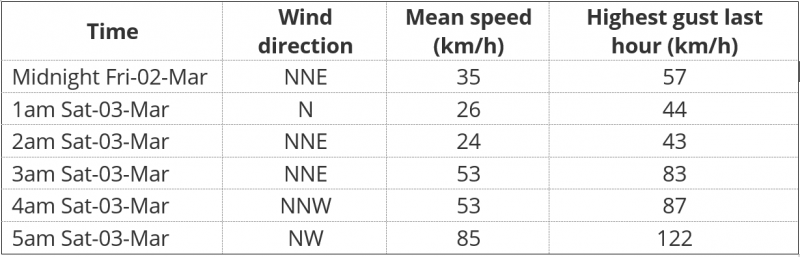
No observations were received between 6am and 11am because power to the reporting site was lost. At Wanganui Airport, the temperature climbed steadily from 12.7 C at midnight Friday 02 March to 17.5 C at 5am Saturday 03 March. (The temperature behaved similarly at Hawera a few hours earlier). This happened because the relatively warm moist air flowing around the northern side of the approaching low was warmed and dried - the Foehn effect - as it passed across the high country to the north of Wanganui. At Ohakea and Palmerston North, the winds were reasonably strong easterlies for some hours before and after dawn, but blew from the northwest for a while around dawn. Two switch-arounds (not quite 180 degrees) of steady to strong-ish winds in a short time is remarkable. Between 4am and 3pm Saturday 03 March, the south to southeasterly wind at Brothers Island had a mean speed of 108 km/h. During this time, the highest gust was 142 km/h.
Crossing the Country
I mentioned earlier that at 6am the low was not far south of Patea and heading for Palmerston North but never got there. This is because it didn't physically cross the North Island. Nevertheless, a graph of mean sea level pressure at Palmerston North (below) for Saturday 03 March 2012 shows that the pressure certainly reached a minimum around dawn before rising steeply again from mid morning.

Mean sea level pressure at Palmerston North.
While lows have distinct structures, they're best not thought of as rotating solid bodies of air - because they're not. Rather they are the manifestation, at the Earth's surface, of processes which have produced a local minimum of pressure. Looking back to the working chart above, we see that there are two lows at 6am: one south of Patea, and another just east of Hawke's Bay. The low south of Patea came ashore east of Wanganui and then decayed, while the "new" low continued to deepen and move away to the east. This decay/development happens because the "driving" atmospheric processes are largely above the Earth's surface and moving with the general flow: they left the Patea low behind and powered the development of the "new" low east of the North Island.
Technical Stuff
Finally, the definition of a "bomb" low is technical and not whimsical. As far as I know, the first mention of the term "bomb" was in a paper by two distinguished meteorological researchers, Fred Sanders and John Gyakum, titled "Synoptic-Dynamic Climatology of the "Bomb"", published in the October 1980 issue of Weather and Forecasting, a journal of the American Meteorological Society. Because of their destructive potential, rapidly deepening lows have been the subject of many a research paper.