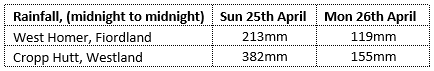
MetService issues severe weather warnings to New Zealanders whenever widespread heavy rain, heavy snow or damaging winds are expected. There are formal criteria that events have to meet or exceed for the forecast to be called a success; the wind criteria are in a previous post, while the rain and snow criteria relate to the total falls required within set periods. Sometimes a warning is considered a false alarm because the event was "on the cusp" of meeting the criteria but its intensity fell just short. These marginal events can be trying for forecasters. However, there has been nothing marginal about the rainfall that occurred over the West Coast of the South Island during the week starting Sunday April 25th 2010. Rainfall amounts far exceeded warning criteria, and there were some very large totals. For example:
The rainfall has been associated with an active front along which a large depression (or Low) subsequently formed over the Tasman Sea. Here is a sequence of satellite pictures showing the Low's development and movement. The enhancement is the same as in an earlier post:

Infra-red satellite image, noon NZ Standard Time, 25 Apr 2010
Initially the band of deep clouds (purple, red and yellow) extend almost in a straight line from New South Wales to Fiordland.

As previous but midnight 25 Apr 2010
As time passes the cloud band perturbs and eventually takes on a comma shape.

Noon 26 Apr 2010

Midnight 26 Apr 2010

Noon 27 Apr 2010
Note how the clouds spiral in towards the centre of the depression in the last two pictures. The pointy part of the cloud near the centre is called a cusp. Its shape results from the flow that is rotating clockwise around the developing depression, with a maximum speed just out from the centre. To the southeast of the centre the flow is splitting and then moving in the opposite direction, creating an abrupt southwestern edge to the cloud there.
In the last satellite picture I've drawn arrows to show how part of the flow in the upper troposphere is wrapping around the depression while another part is being drawn into the westerly airstream at higher latitudes. The animation below illustrates how a depression shapes the air around it, with the red and purple areas resembling the areas of cloud in the satellite pictures.

How regions of cold dry air (blue) and warm moist air (red) are shaped by a depression
Once depressions reach the stage of forming a cusp they are becoming mature. There is little further scope for them to develop, although a new development often occurs downstream as the older system fizzles. By looking at animations of satellite images on TV or on the internet you may be able to identify systems that complete a full life cycle, and others that are disrupted in some way.