November 2009
We've just had some very strong winds over NZ, so I'm writing this short post to give some background to it. First of all, check out these peak northwesterly wind speeds from the morning of Wednesday 4 November:
mean wind (including gusts and lulls) strongest gust South West Cape (Stewart Island) 143 km/h183 km/hCastlepoint (Wairarapa coast)109 km/h161 km/hPuysegur Point (bottom of Fiordland)100 km/h144 km/h
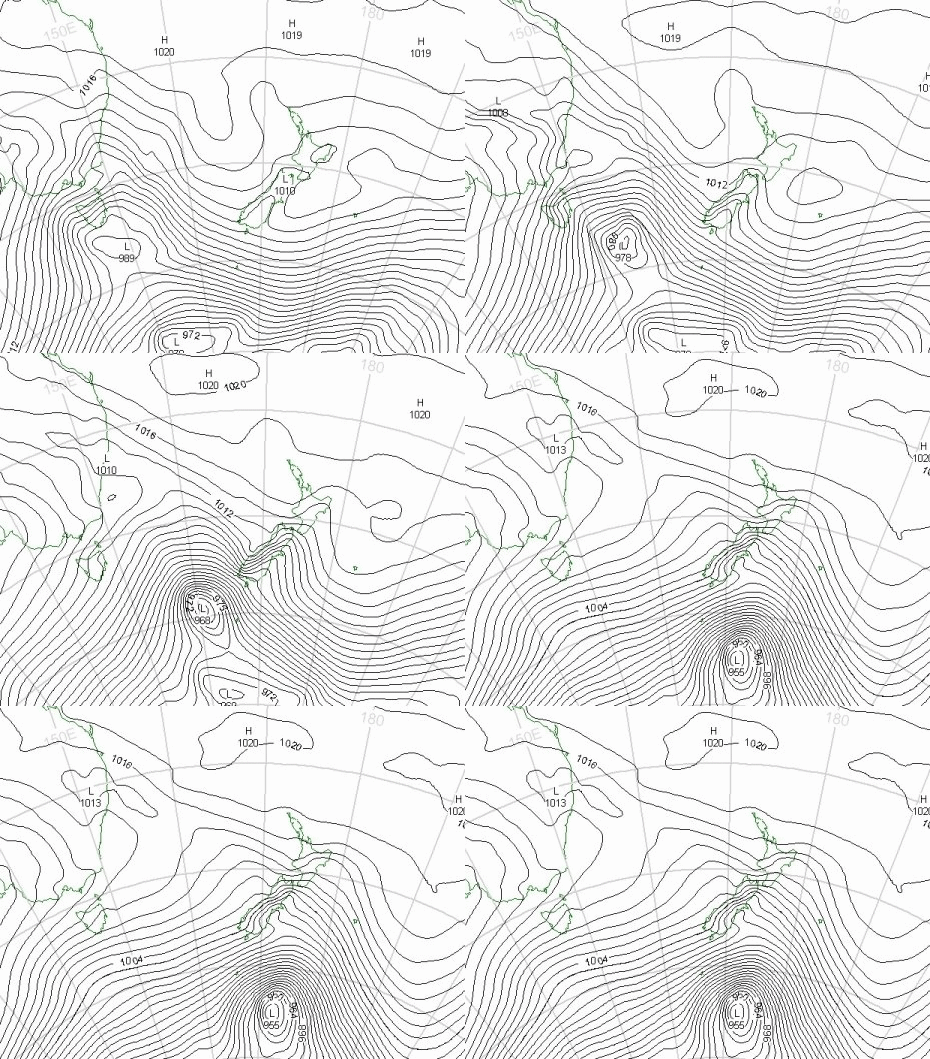
To get a feel for the strength of these winds, compare them with those in my post about the Great Northwesterly Storm of August 1975. At this time of the year we often get strong wind events, as Bob McDavitt explained at the end of his post on the Spring Equinox. The weather maps for the 24 hours to midday are below, and show a deep low (or depression) passing just south of the country. The strongest winds were at about the time the low was closest to us.
Note how closely the isobars are bunched together in this map (I have chosen to display isobars at 2 hectoPascal intervals). When the isobars are squeezed together, that means a strong air pressure gradient and lots of wind (see here).
In addition to the strong pressure gradient, the topography of NZ modifies the flow (see the post on Bottlenecks) which is why Castlepoint also features on the short list above. But the very strongest winds were at the bottom of South Island in this event.
