MetService's forecasting team produces marine forecasts for New Zealand coastal waters. These forecasts are routinely issued four times every day; they are monitored continually and updated more frequently if conditions warrant it.
Coastal Forecasts
Forecasts for coastal waters cover the area from the coastline to 60 nautical miles (about 100km) out to sea. The New Zealand coast is divided into 18 areas, as shown in figure 1:
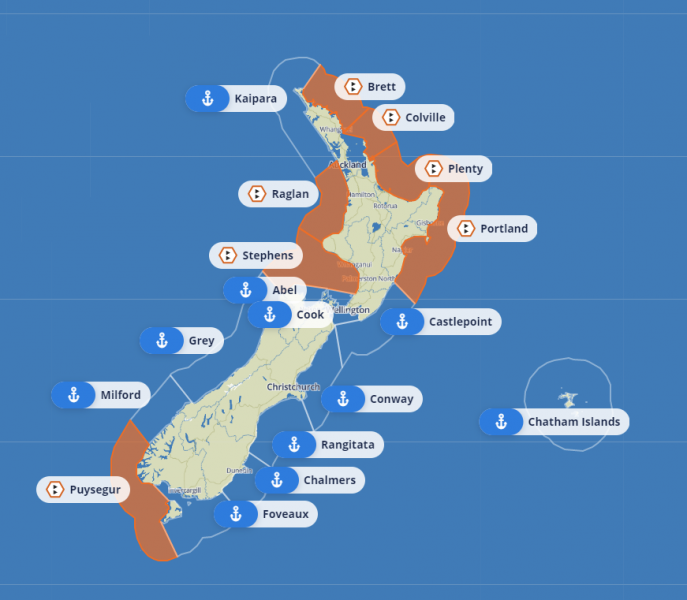 Figure 1: MetService coastal marine areas
As can be seen from the map, almost all the coastal forecast areas are very large. New Zealand’s mountainous terrain has a large influence on the wind flow – it can vary significantly around the next headland or in the lee of the next set of hills. The wind flow, in turn, affects the local sea conditions (see figure 2). For these and other reasons, coastal forecasts describe the average weather conditions expected within the area, and any significant changes expected to those conditions.
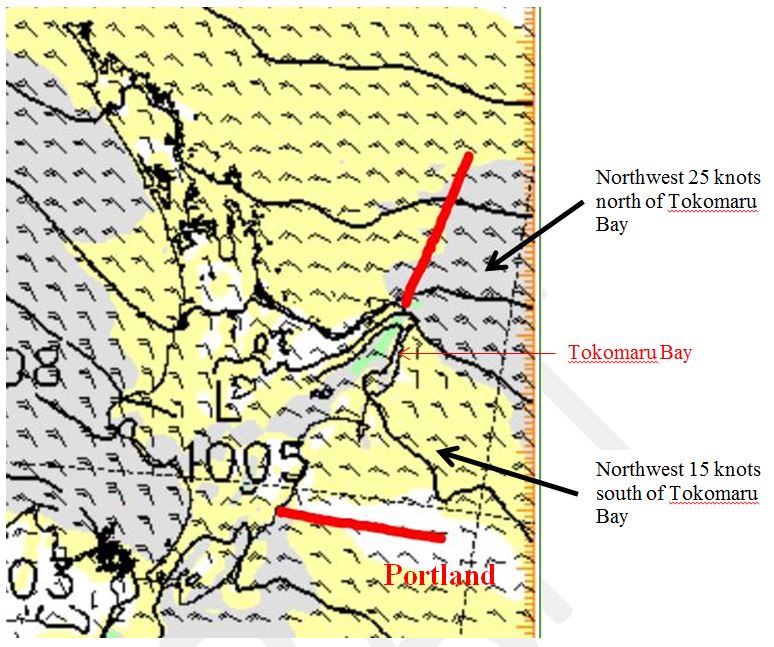 Figure 2. Example of MetService wind guidance with different wind speeds within the same coastal area caused by the topography.
Because they are broadcast on VHF and HF radio and via satellite, coastal forecasts have a restriction on their length which in turn dictates the amount of detail that is possible. The forecaster will include additional detail, like notable variations expected across a coastal area, if space permits (see figure 3). The weather for today and tomorrow is described in detail, followed by a brief outlook for the following 3 days (5 days in total).
Abel Coastal Forecast
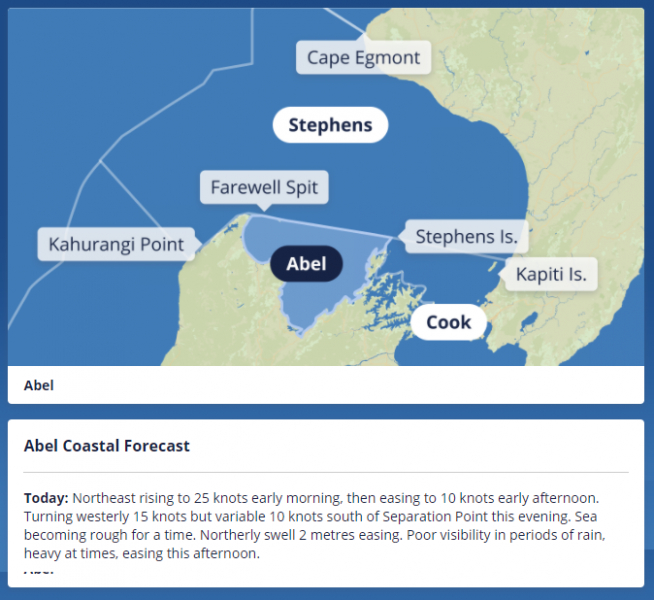 Figure 3. Example of a MetService coastal forecast with the area split (north and south of Separation Point).
What's included in the Coastal forecast
Situation
This gives an overview of the national weather situation for the next 5 days (the forecast period), describing fronts, lows and highs (see figure 4).
Castlepoint Coastal forecast
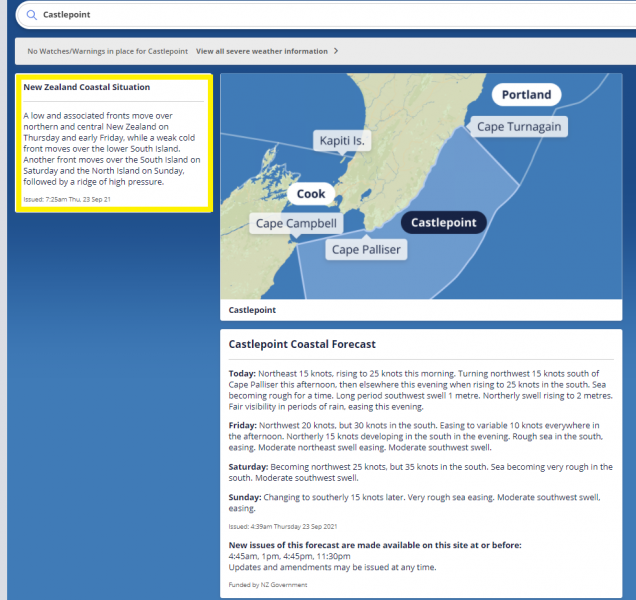 Figure 4: Example of a MetService coastal situation statement (highlighted in yellow).
Warnings
- Gale Warnings: When mean wind speeds are expected to be 34 knots to 47 knots.
- Storm Warnings: When mean wind speeds are expected to be greater than 47 knots.
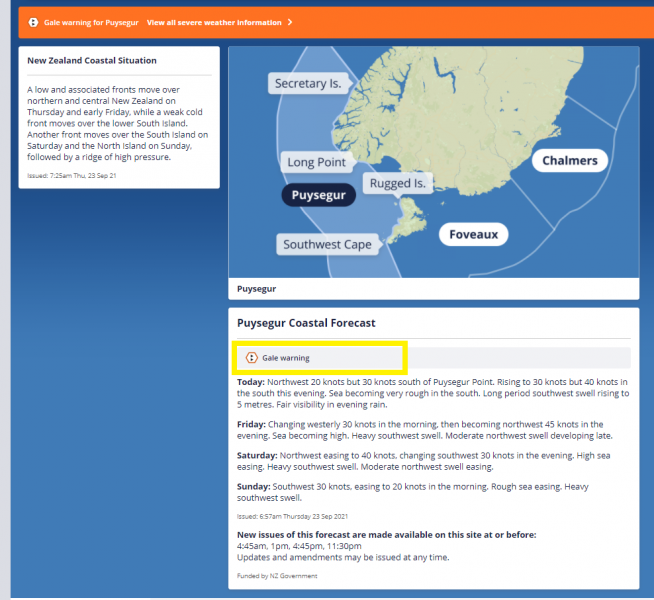 Figure 5: Example of a MetService coastal warning (highlighted in yellow).
Wind
Winds are mean time-averaged wind speeds, as would be measured over 10 minutes and then averaged. Speed is in knots (kt) and forecast to the nearest 5 knots, and direction is defined as where the wind is coming from using eight compass points (N, NE, SW, etc).
- Any specified wind speed implies a 10 knots variation. For example, when a wind of 15 knots is forecast, that implies winds between 10 and 20 knots can be expected.
- Expect short-lived gusts to be 50% or more above the mean wind speed, depending on the stability of the air and whether the wind is onshore or offshore
- Any changes during the forecast period of 10 knots or more in speed or 90 degrees or more in direction are included.
In coastal forecasts, 10 knots is the minimum wind speed that we forecast. Wind speeds of 5 knots are not stated; instead the term variable 10 knots is used. When wind speeds vary significantly over a coastal forecast area, we can split it up if space allows (see figure 6).
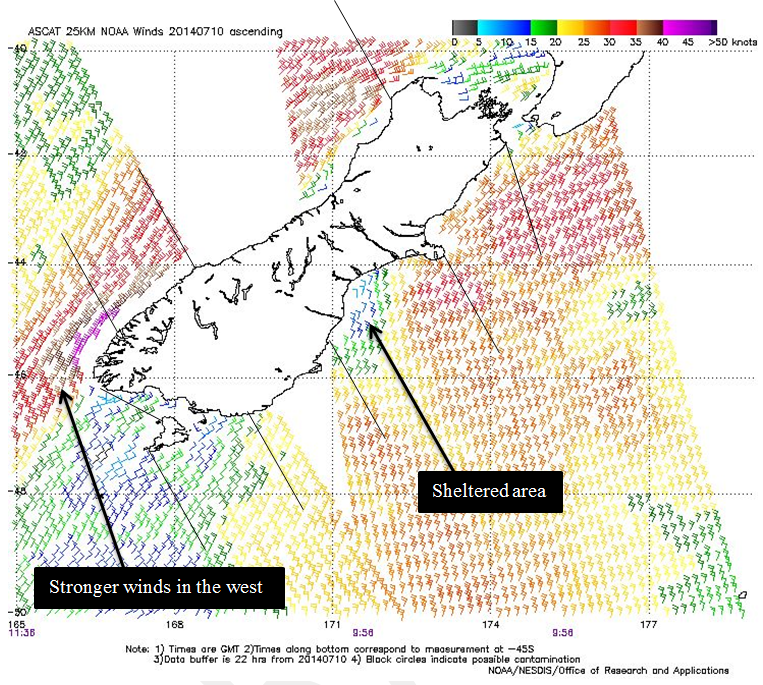 Figure 6. Example of significantly different winds over a coastal forecast area taken from ASCAT satellite data on 10/07/14.
Puysegur Point Forecast (figure 6): Northeast 40 knots but 20 knots east of Puysegur Point.
Sea state
What we call sea state is the effect that the local winds have on the sea conditions – this is independent of travelling swell waves generated by winds outside of the local area. For brevity, only the highest expected sea state through the forecast period is mentioned along with the trend (e.g. easing, rising). Sea state is related to the Beaufort scale and describes the state of the sea surface rather than just the resulting wave heights, known as ‘wind waves’. The World Meteorological Organization and MetService use the Douglas Sea Scale to define sea state. Figure 7 gives sea state as a function of wind speed, and Figure 8 displays the relationship between the Beaufort scale and MetService sea state.
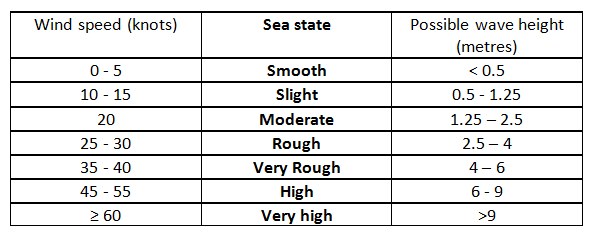 Figure 7: Sea state as a function of wind speed.
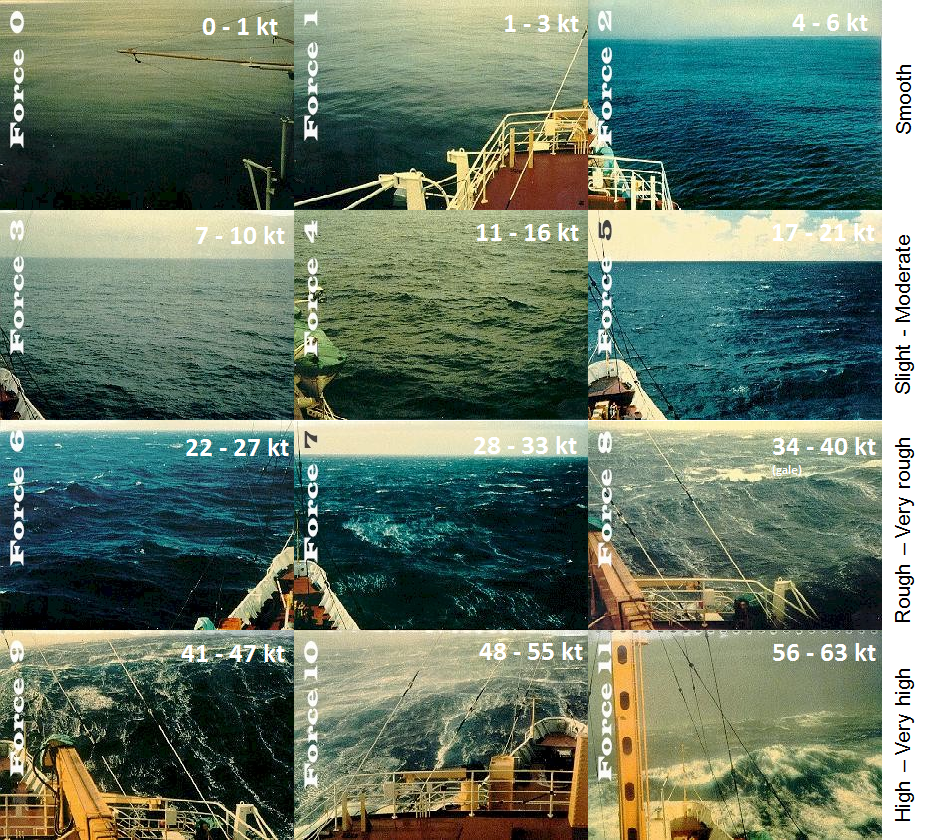 Figure 8: Relationship between the Beaufort Scale and sea state (right). Images from http://en.wikipedia.org/wiki/Beaufort_scale
Note that wind wave heights are significantly affected by local conditions, such as whether the wind is onshore or offshore.
Swell
Swell refers to waves that develop over a longer period of time than locally-generated wind waves, and over a larger area. Swell waves (often just called swell) can travel long distances and usually originate hundreds or thousands of kilometres away from where they have an impact. Swell waves have longer periods (the time between waves passing by) than wind waves and so affect craft differently. Swell height can be described as:
- Significant swell height: the average peak-to-trough height of the highest one third of the waves. This is what you’d generally ‘eyeball’ the wave height to be.
- Occasional wave height: 50% higher than the significant wave height. This is generally the biggest wave of a group of waves.
- Maximum wave height: The highest reported wave height over a long duration (e.g. one day) and can be twice the significant wave height.
Coastal forecasts report the highest significant wave height of those swells present, as well as the direction and trend. Swells are only included if their height is 1 metre or more, and are rounded to the nearest metre. Two different swells can be forecast for the same area, provided they have a difference of more than 90 degrees in direction or 2 metres in height.
Visibility/weather
Weather such as precipitation or fog is only mentioned if it will reduce the visibility to fair or worse.
- Fair visibility: 2-5 nautical miles (4-9 km)
- Poor visibility: 0.5-2 nm (1–4 km)
- Very poor visibility: Less than 0.5 nm (1 km)
Visibility isn’t mentioned with fog as, by definition, the visibility is less than 0.5 nm (1 km) in fog. The type of weather reducing the visibility is mentioned (e.g. showers, rain, drizzle), and areas with a moderate or high risk of thunderstorms are also mentioned.
Raglan Coast forecast
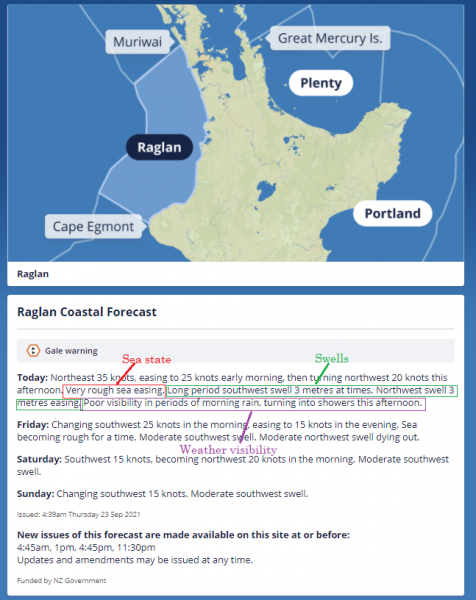 Figure 9: Example of MetService coastal forecast sea state, swell and weather.
Timing
We have clearly-defined timings for our marine forecasts; however, as some of the coastal areas are quite large/long/wide, these times can be lengthened by using more generic terms like morning, afternoon and evening. This may also be appropriate for gradual changes or where there is uncertainty in the timing.
 Figure 10: MetService timing descriptions.
These timings are very similar to those used in public forecasts.